PR and ROC curves
The purpose of this vignette is to show how to trace the PR and ROC curves from SDeMo models.
julia
using SpeciesDistributionToolkit
using CairoMakie
using PrettyTables
We will work on the demo data:
julia
X, y = SDeMo.__demodata()
sdm = SDM(PCATransform, DecisionTree, X, y)
PCATransform → DecisionTree → P(x) ≥ 0.5We can now set a series of points at which to evaluate the threshold. Because we are calling the cross-validation function, this will not retrain our model, and therefore it is safe to apply this method on an already trained model.
julia
thresholds = LinRange(0.01, 0.99, 50)
cv = [crossvalidate(sdm, montecarlo(sdm; n = 5); thr = t) for t in thresholds];
We can then plot the output:
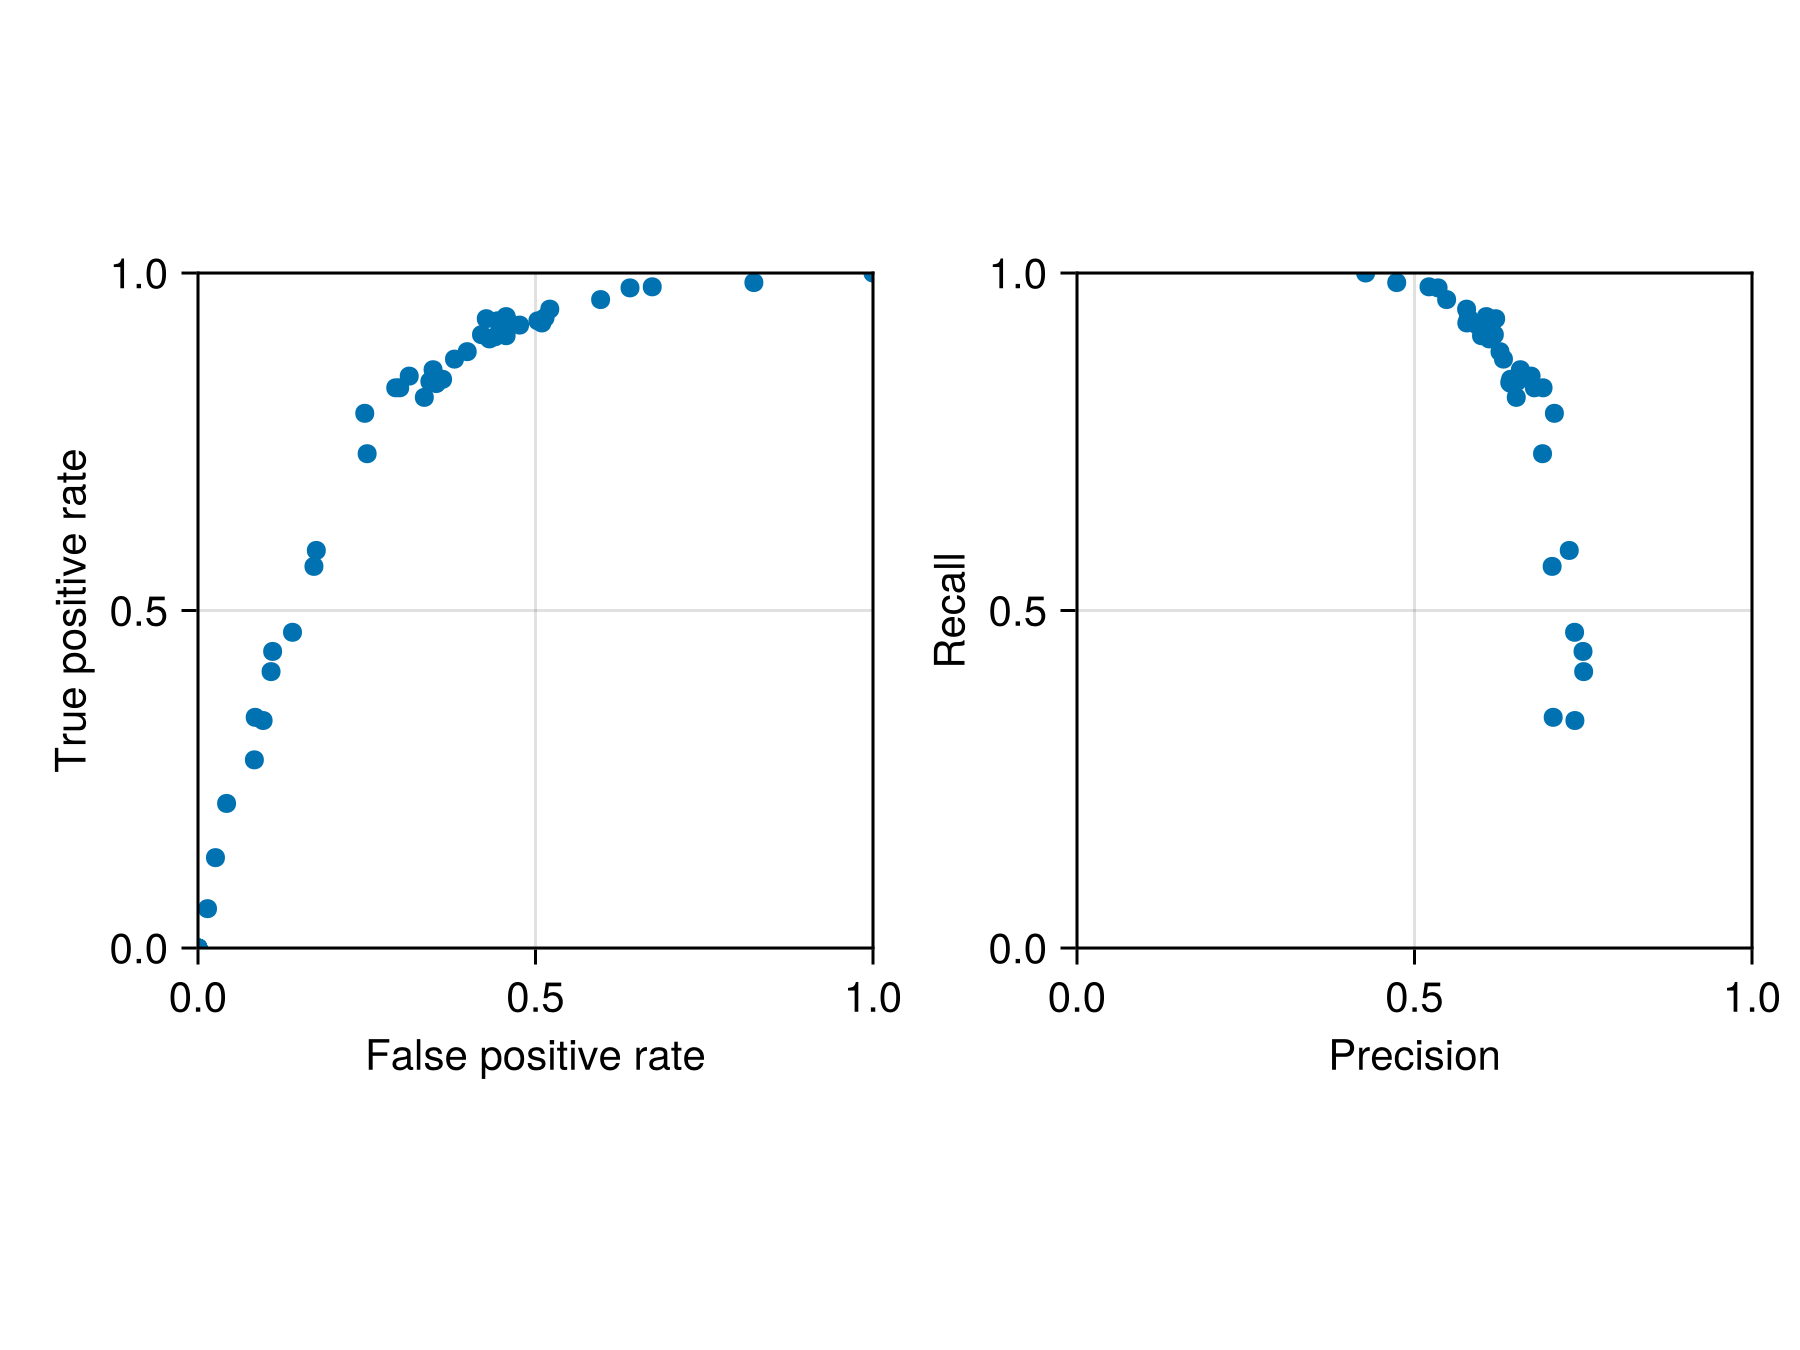
Code for the figure
julia
f = Figure()
ax =
    Axis(f[1, 1]; aspect = 1, xlabel = "False positive rate", ylabel = "True positive rate")
scatter!(ax, [fpr(s.validation) for s in cv], [tpr(s.validation) for s in cv])
ax2 = Axis(f[1, 2]; aspect = 1, xlabel = "Precision", ylabel = "Recall")
scatter!(
    ax2,
    [SDeMo.precision(s.validation) for s in cv],
    [SDeMo.recall(s.validation) for s in cv],
)
xlims!(ax, 0.0, 1.0)
ylims!(ax, 0.0, 1.0)
xlims!(ax2, 0.0, 1.0)
ylims!(ax2, 0.0, 1.0)
We can then train the model:
julia
train!(sdm)PCATransform → DecisionTree → P(x) ≥ 0.338It is a good idea to also perform a sanity check, by verifying that the distribution of predicted values makes sense knowing their true label (the threshold is in red):
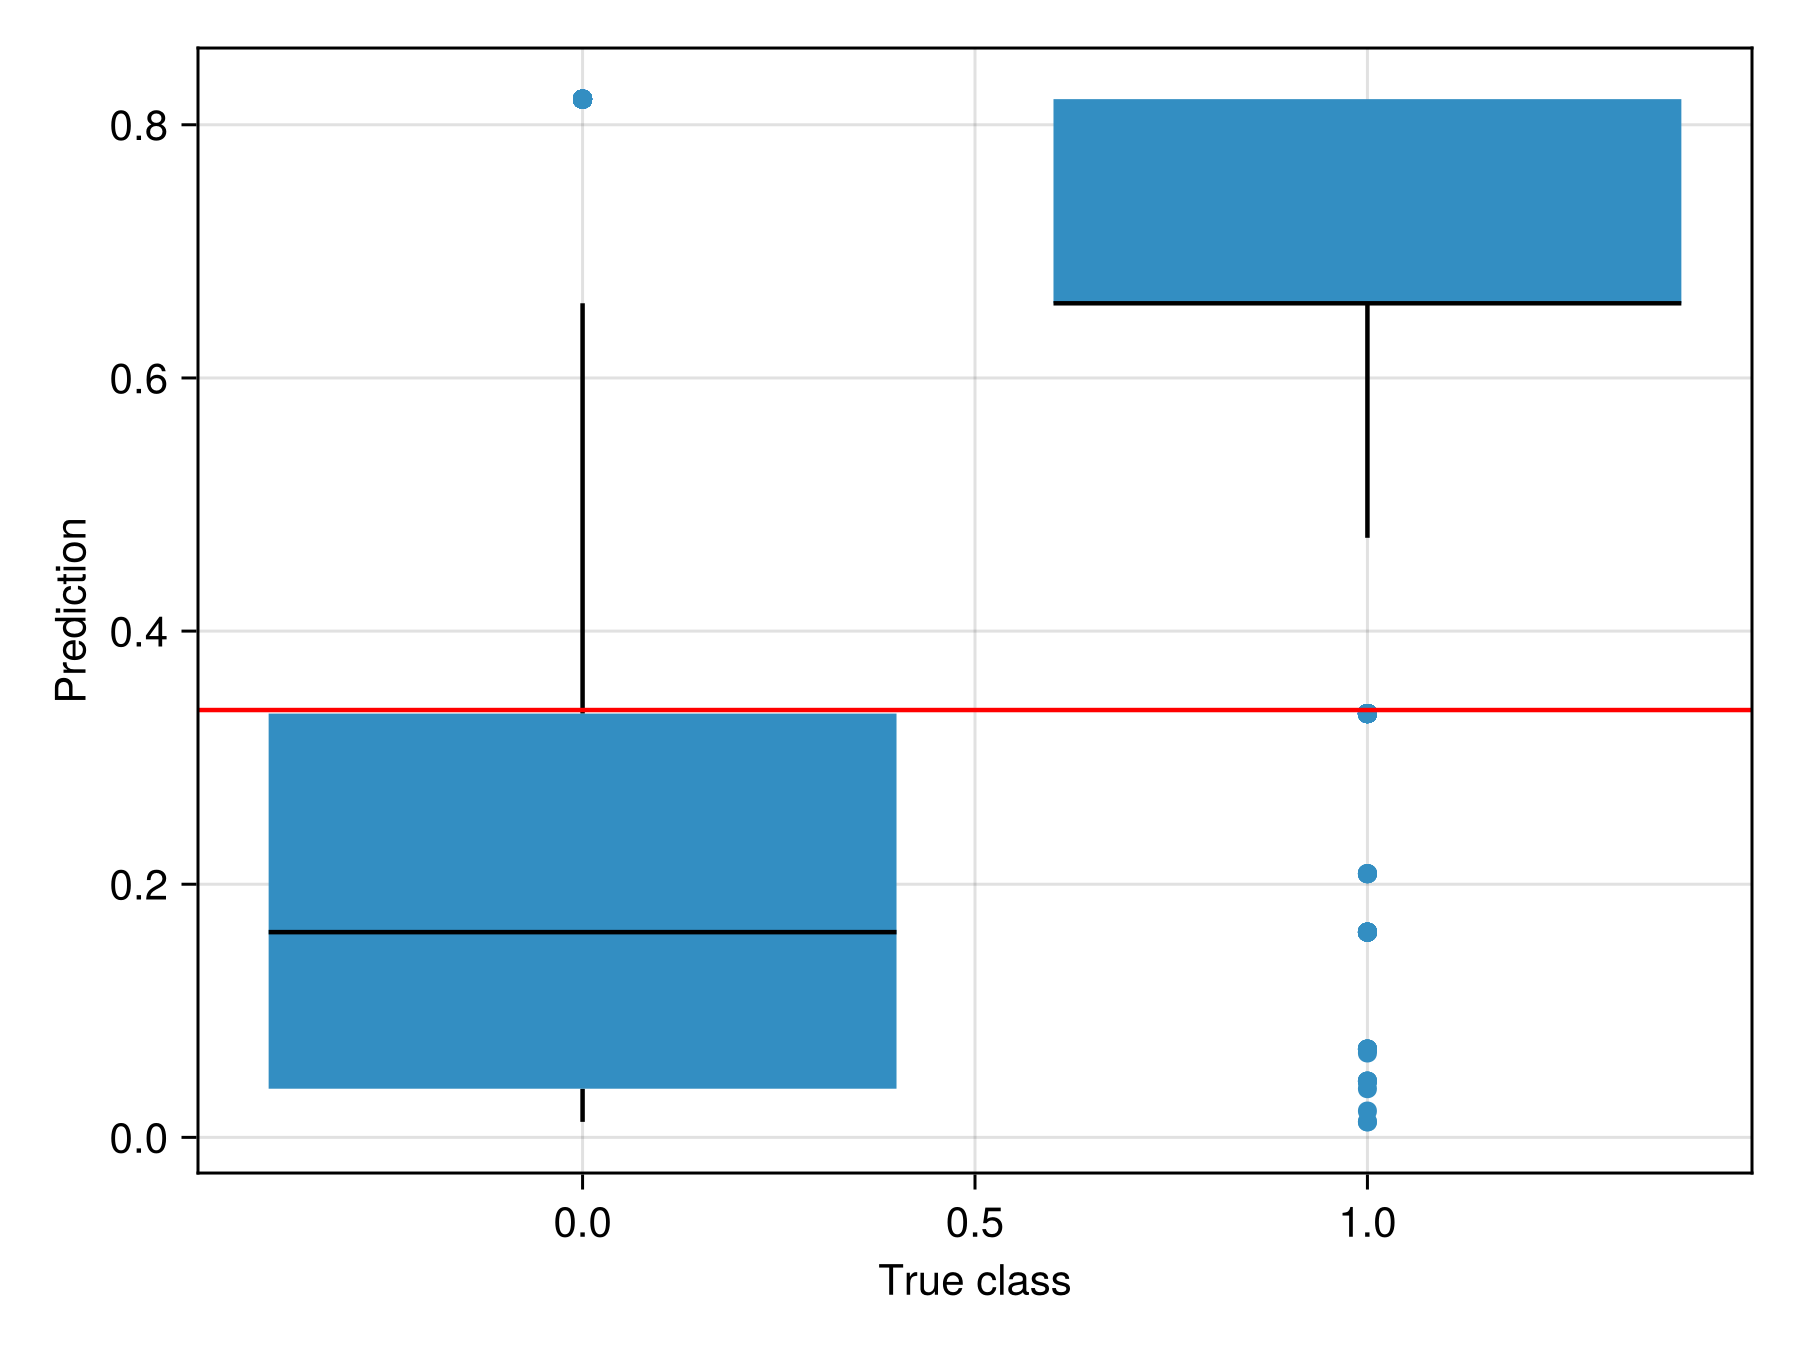
Code for the figure
julia
f = Figure()
ax = Axis(f[1, 1]; xlabel = "True class", ylabel = "Prediction")
boxplot!(ax, labels(sdm), predict(sdm; threshold = false))
hlines!(ax, [threshold(sdm)]; color = :red)