Variograms
TK
using SpeciesDistributionToolkit
const SDT = SpeciesDistributionToolkit
using PrettyTables
using CairoMakie
using Statistics
Get some info on temperature
polygon = getpolygon(PolygonData(NaturalEarth, Countries))["Austria"]
temperature = SDMLayer(RasterData(CHELSA2, AverageTemperature); SDT.boundingbox(polygon)...)
mask!(temperature, polygon);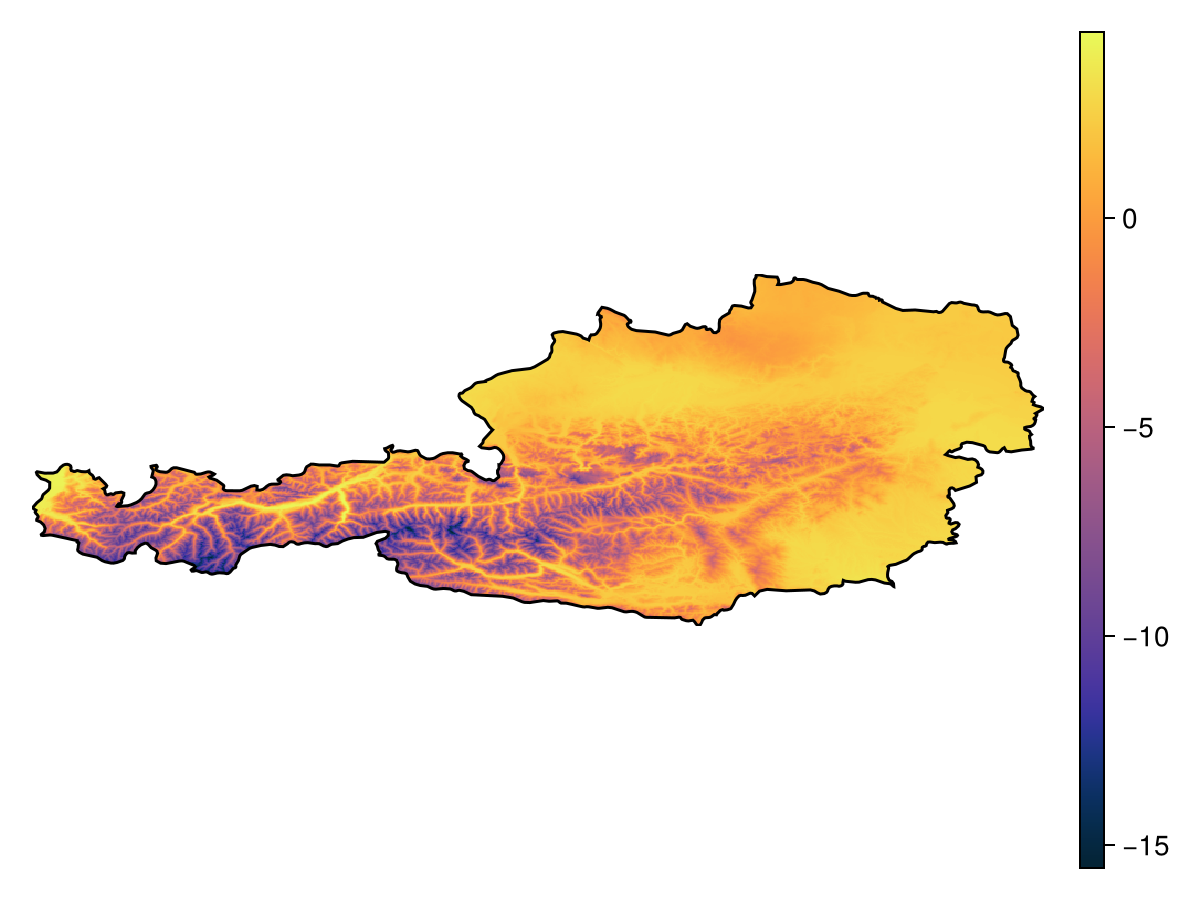
Code for the figure
f = Figure()
ax = Axis(f[1,1]; aspect=DataAspect())
hm = heatmap!(ax, temperature, colormap=:thermal)
lines!(ax, polygon, color=:black)
hidespines!(ax)
hidedecorations!(ax)
Colorbar(f[1,2], hm)
get variogram
x, y, n = variogram(temperature; width=10., shift=5.);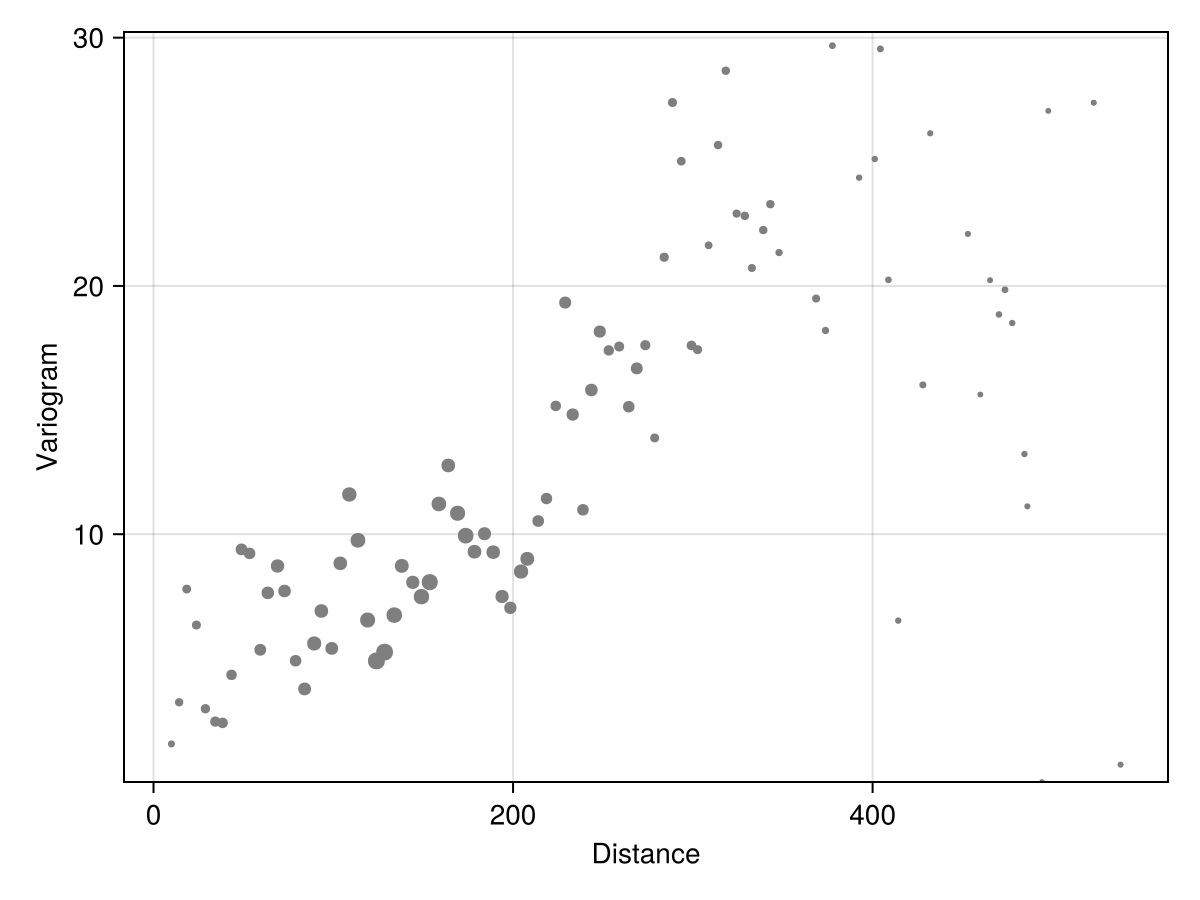
Code for the figure
f = Figure()
ax = Axis(f[1,1]; xlabel="Distance", ylabel="Variogram")
scatter!(ax, x, y, markersize=n ./ maximum(n) .* 8 .+ 4, color=:grey50)
ylims!(ax, quantile(y, [0.0, 0.9])...)
can fit a model
Not exported
in progress
these are also convenience functions
G = SDT.fitvariogram(x, y, n; family=:gaussian);
E = SDT.fitvariogram(x, y, n; family=:exponential);
S = SDT.fitvariogram(x, y, n; family=:spherical);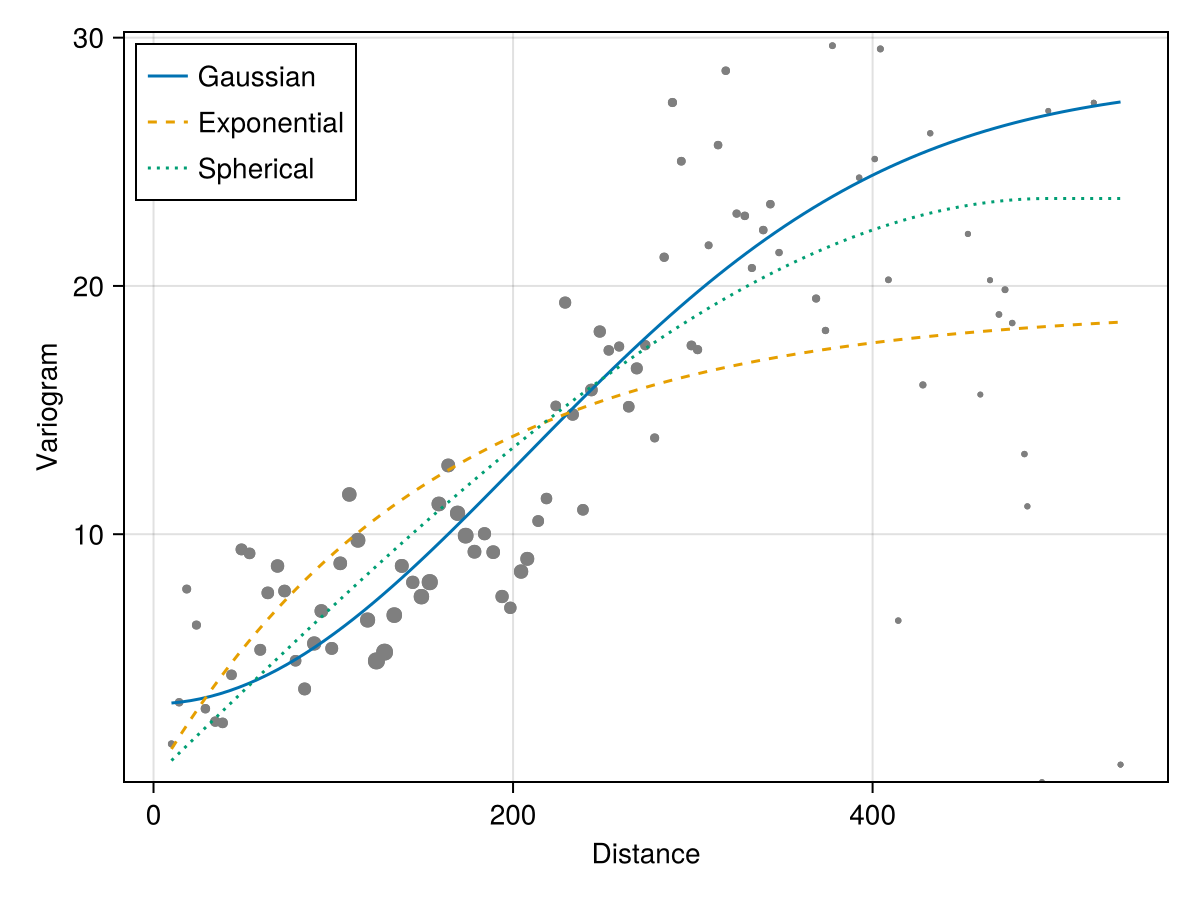
Code for the figure
scatter!(ax, x, y, markersize=n ./ maximum(n) .* 8 .+ 4, color=:grey50)
vx = LinRange(extrema(x)..., 100)
lines!(ax, vx, G.model.(vx), label="Gaussian")
lines!(ax, vx, E.model.(vx), label="Exponential", linestyle=:dash)
lines!(ax, vx, S.model.(vx), label="Spherical", linestyle=:dot)
ylims!(ax, quantile(y, [0.0, 0.9])...)
axislegend(ax, position=:lt)
check which are better
M = permutedims(hcat([[m.range, m.sill, m.nugget, m.error] for m in [G, E, S]]...));
M = hcat(["Gaussian", "Exponential", "Spherical"], M);pretty_table(
M;
alignment = [:l, :c, :c, :c, :c],
backend = :markdown,
column_labels = ["Model", "Range", "Sill", "Nugget", "Error"],
formatters = [fmt__printf("%3.3f", [2, 3, 4, 5])],
)| Model | Range | Sill | Nugget | Error |
|---|---|---|---|---|
| Gaussian | 503.149 | 28.222 | 3.171 | 4.150 |
| Exponential | 461.813 | 19.117 | 0.161 | 5.368 |
| Spherical | 498.146 | 23.522 | 0.183 | 4.479 |
Related documentation
SpeciesDistributionToolkit.variogram Function
variogram(L::SDMLayer; samples::Integer=2000, bins::Integer=100; kwargs...)Generates the raw data to look at an empirical semivariogram from a layer. This method will draw samples pairs of points at random, then aggregate them in bins bins.
This returns three vectors: the empirical center of the bin, the semivariance within this bin, and the number of samples that compose this bin.
sourceSpeciesDistributionToolkit.fitvariogram Function
fitvariogram(x, y, n; family = :gaussian)Fits a variogram of the given family based on data representing the central bin distance x, the semivariogram y, and the sample size n. The data are returned as a named tuple containing the range, the sill, the nugget, the error, and the model. The model is a function that can be called on a given distance to obtained the best fit variogram.
Possible values of family are :gaussian (default), :spherical, and :exponential.
Values are optimized using the Nelder-Mead algorithm with samples samples and maxiter iterations.
fitvariogram(L::SDMLayer; family::Symbol=:gaussian, kwargs...)Fits the variogram based on a layer. The kwargs... are passed to variogram.