Calibrating SDM outputs
The purpose of this vignette is to show how to calibrate the results of an SDM.
using SpeciesDistributionToolkit
using CairoMakie
We will work on the demo data:
X, y, C = SDeMo.__demodata()
sdm = SDM(PCATransform, NaiveBayes, X, y)
variables!(sdm, ForwardSelection)
☑️ PCATransform → NaiveBayes → P(x) ≥ 0.537This model returns the following class scores:
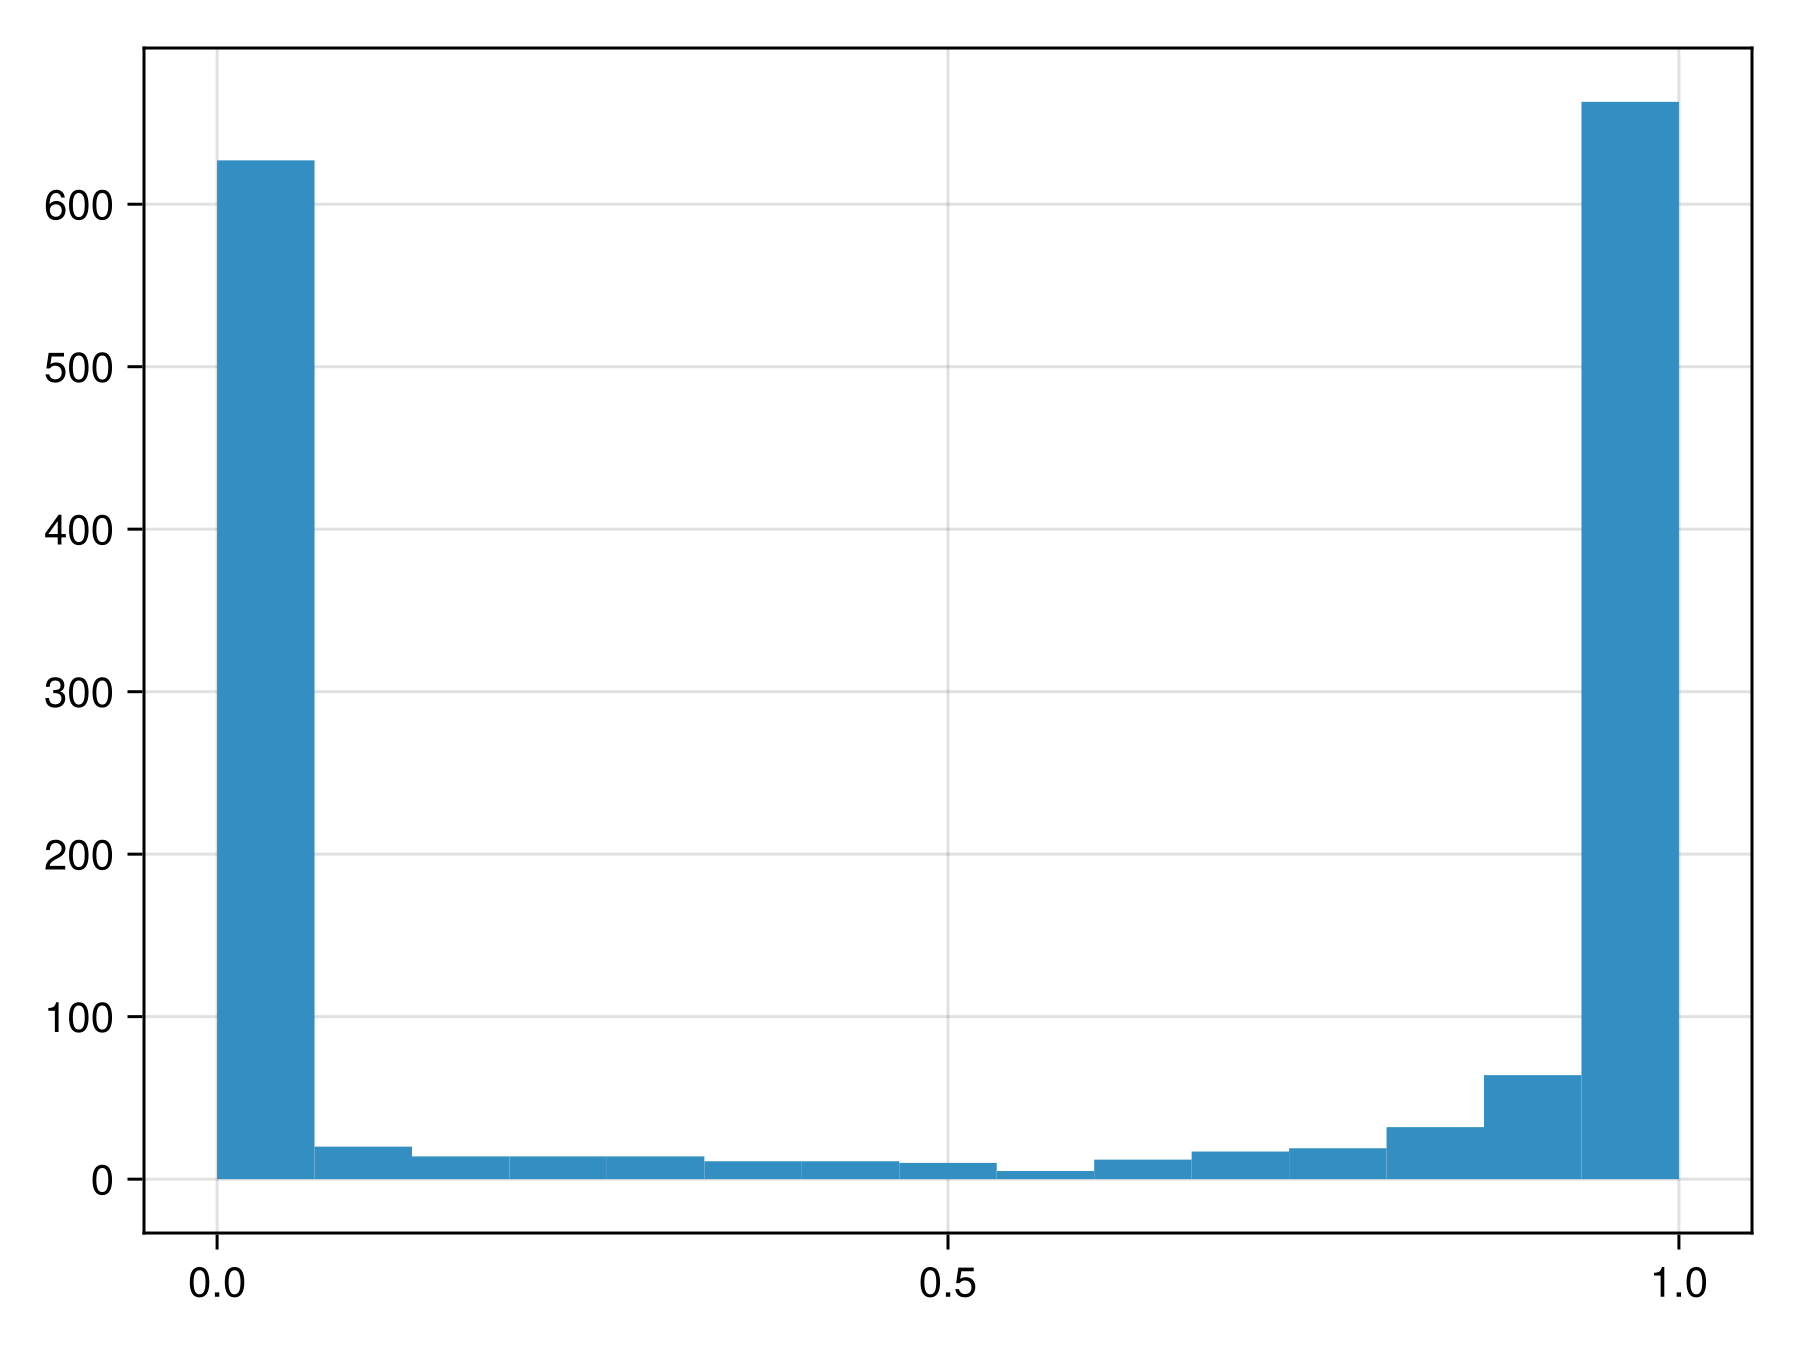
Code for the figure
f = Figure()
ax = Axis(f[1, 1])
hist!(ax, predict(sdm; threshold=false))
To figure out whether these are close to actual probabilities, we can look at the reliability curve
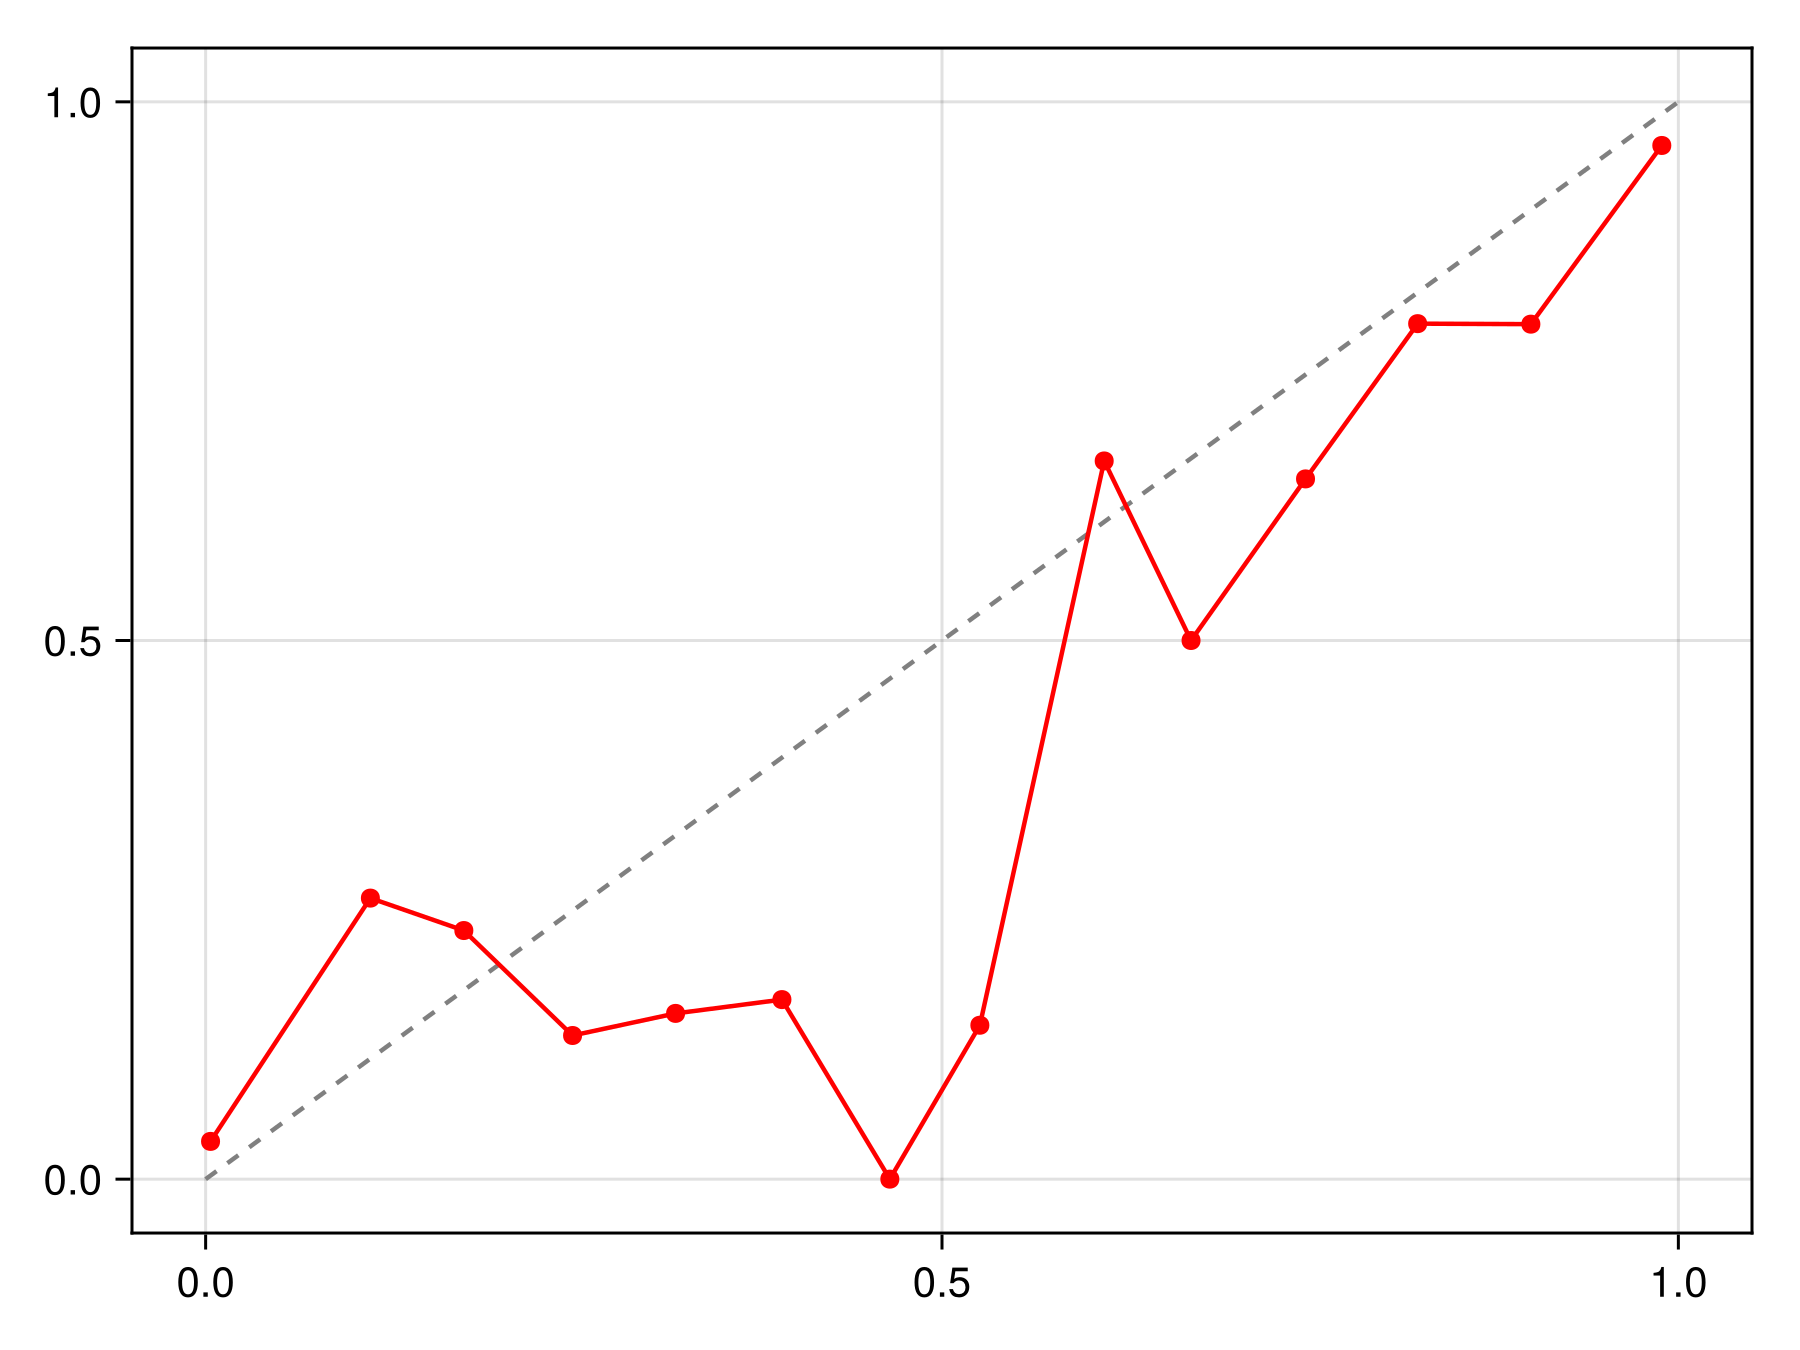
Code for the figure
f = Figure()
ax = Axis(f[1, 1])
lines!(ax, [0, 1], [0, 1], color=:grey, linestyle=:dash)
scatterlines!(ax, reliability(sdm, bins=15)..., color=:red)
We can apply different types of calibration functions, such as for example isotonic regression:
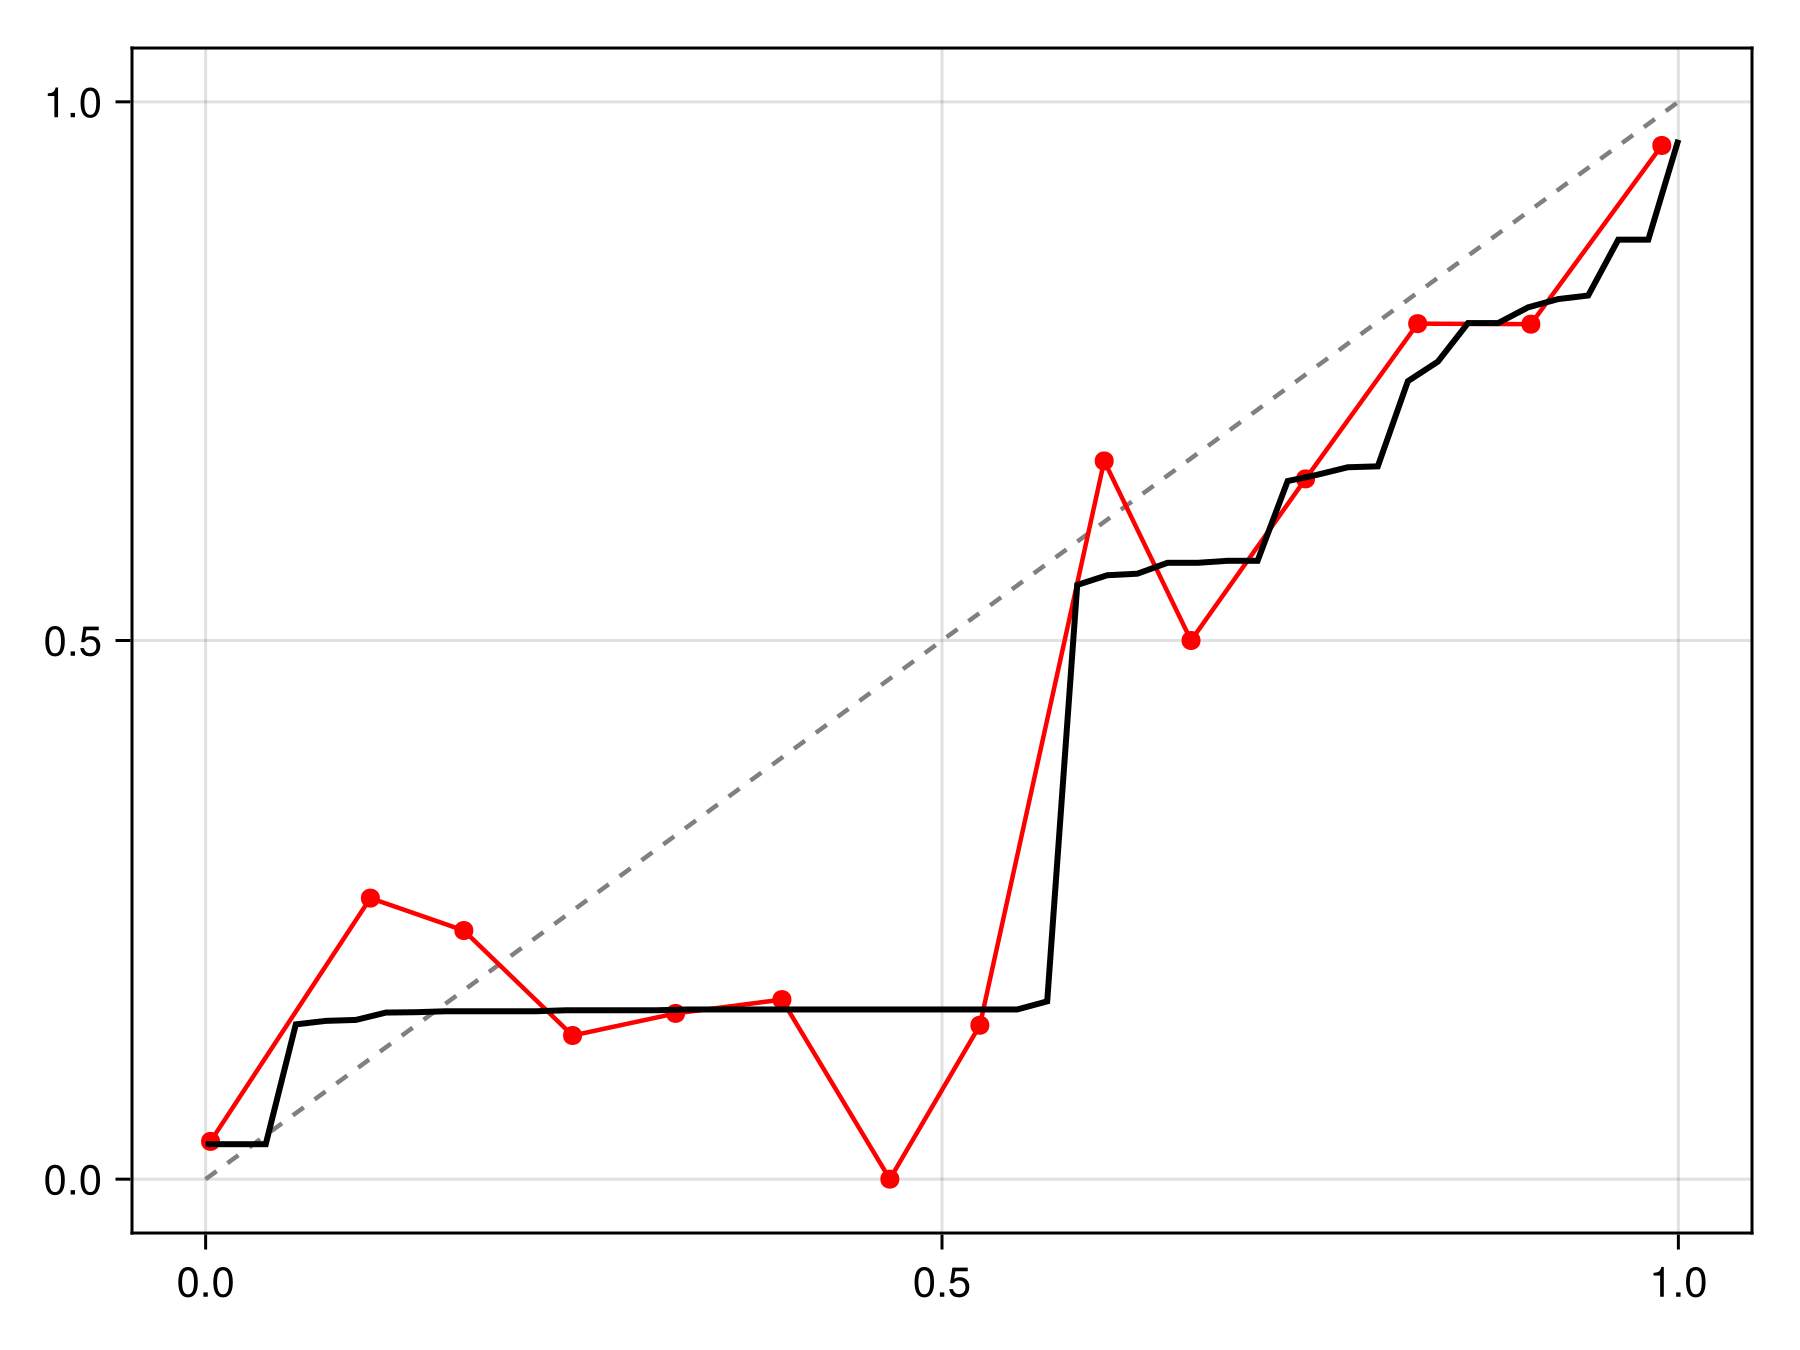
C = calibrate(IsotonicCalibration, sdm)IsotonicCalibration(SDeMo.var"#evaluate#PAVA##2"{Vector{Float64}, Vector{Float64}}([0.03273322422258593, 0.15315315315315314, 0.576923076923077, 0.6521739130434782, 0.7777777777777778, 0.7894736842105263, 0.813953488372093, 0.8769230769230769, 0.9642857142857143], [0.001943584037570504, 0.057353755677874985, 0.5783821702946562, 0.7316721761887174, 0.8139804551308853, 0.8501674915654841, 0.8974406008087837, 0.940508438805775, 0.9923295115089336, 0.9923295115089336]))The calibration can be applied by passing it to the correct function, which returns a function to correct a point prediction:

Code for the figure
f = Figure()
x = LinRange(0.0, 1.0, 50)
ax = Axis(f[1, 1])
lines!(ax, [0, 1], [0, 1], color=:grey, linestyle=:dash)
scatterlines!(ax, reliability(sdm, bins=15)..., color=:red)
lines!(ax, x, correct(C).(x), color=:black, linewidth=2)
We can check that this calibration is indeed making the model more reliable compared to the initial version:
Code for the figure
f = Figure()
x = LinRange(0.0, 1.0, 50)
ax = Axis(f[1, 1])
lines!(ax, [0, 1], [0, 1], color=:grey, linestyle=:dash)
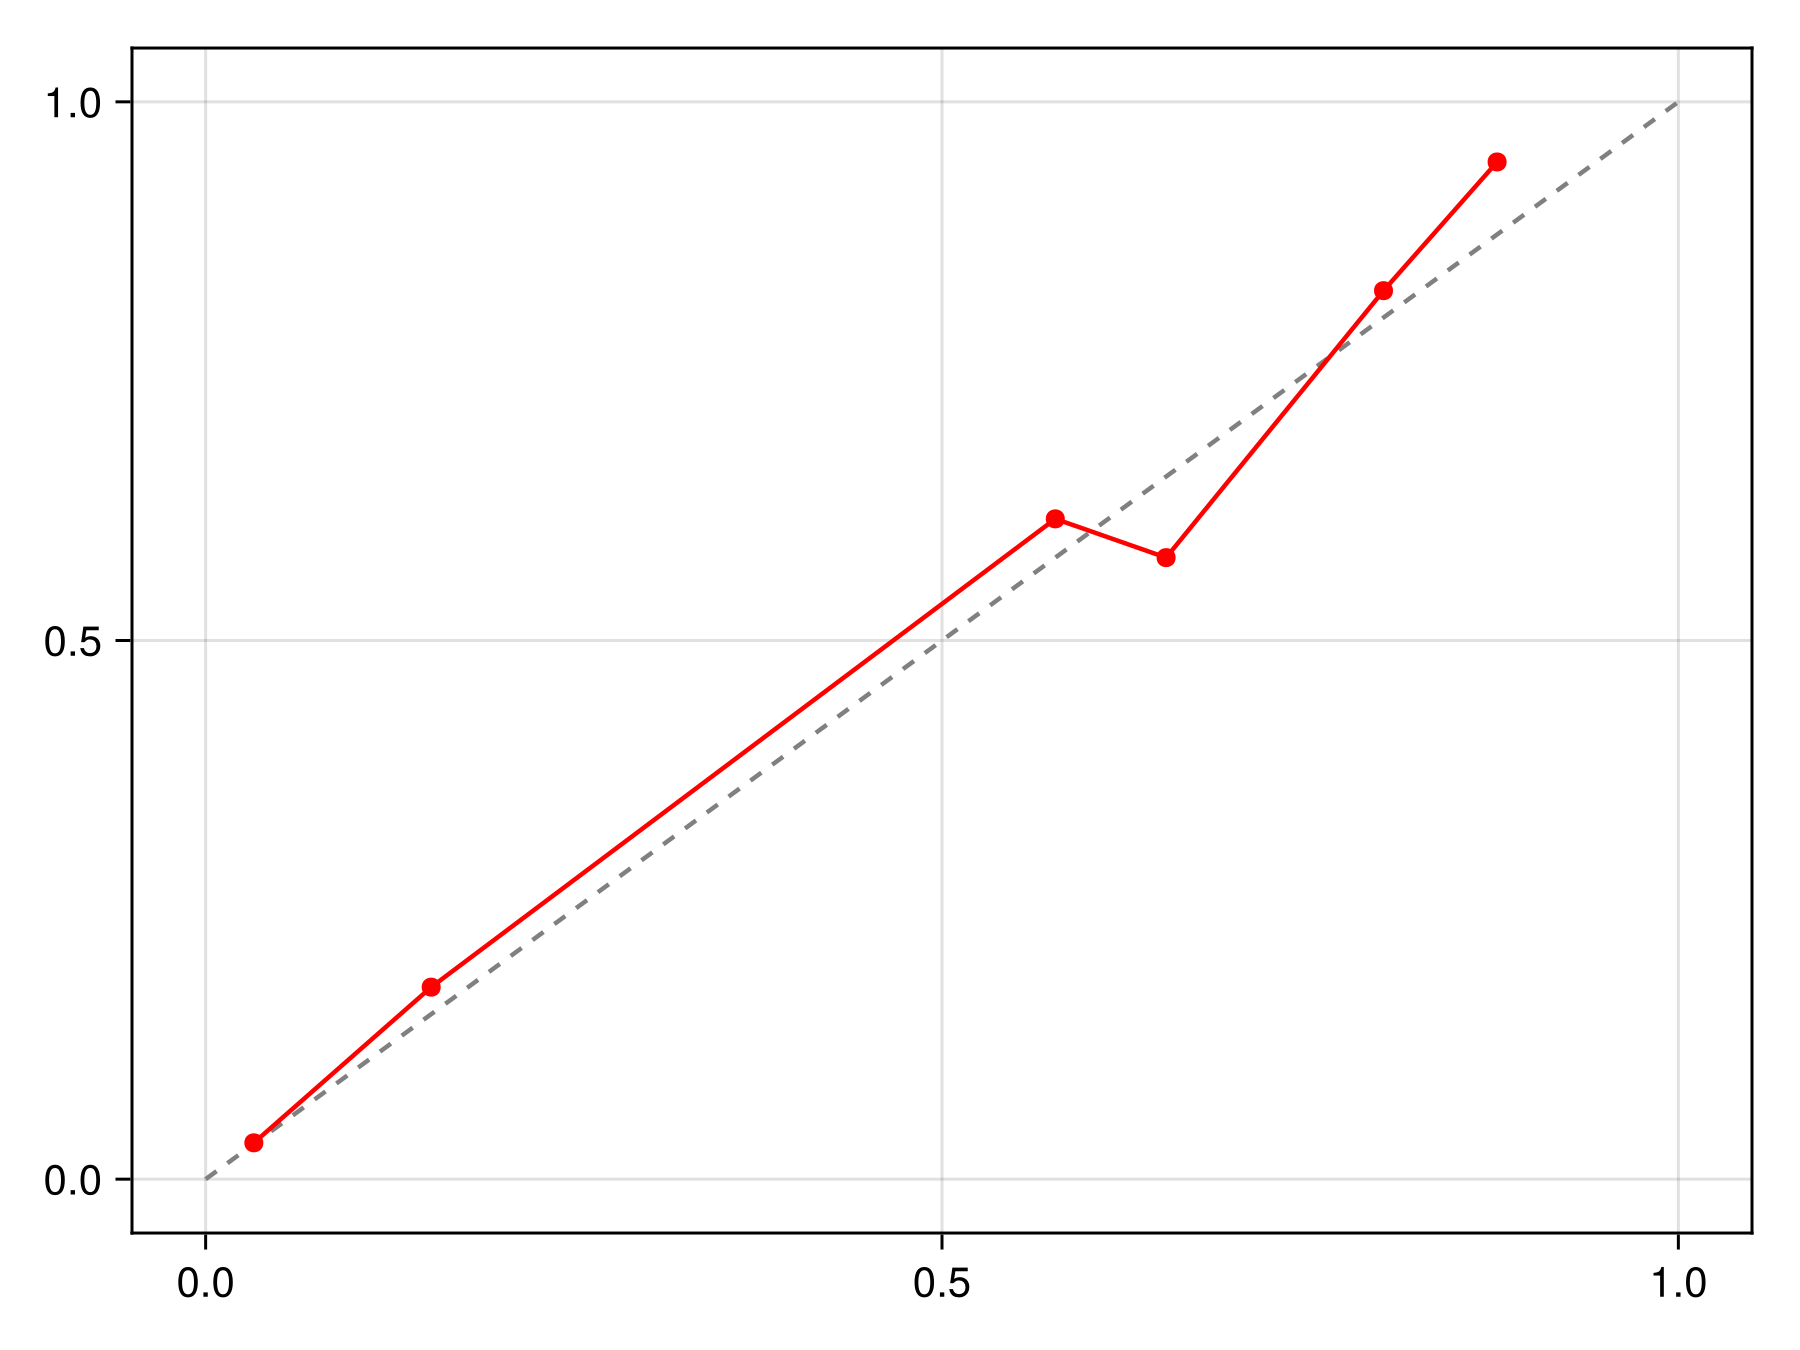
scatterlines!(ax, reliability(sdm, bins=15, link=correct(C))..., color=:red)It is possible to pass a sample keyword to calibrate to only use a series of training points for calibration. This allows to use multiple samples to estimate the calibration function:
samples = first.(bootstrap(sdm))
C = [calibrate(IsotonicCalibration, sdm; samples=s) for s in samples]
cfunc = correct(C)
#correct##2 (generic function with 1 method)The correction function will then average the results for each calibration to return the final probability:
Code for the figure
f = Figure()
x = LinRange(0.0, 1.0, 50)
ax = Axis(f[1, 1])
lines!(ax, [0, 1], [0, 1], color=:grey, linestyle=:dash)
scatterlines!(ax, reliability(sdm, bins=15)..., color=:red)
lines!(ax, x, cfunc.(x), color=:black, linewidth=2)
The package also implements Platt's calibration with a fast algorithm, which is appropriate when the relationship between scores and probabilities is sigmoid.