Caclulating zonal statistics
In this tutorial, we will calculate the average temperature across different countries, and present a map that highlights which of them is the warmest.
using SpeciesDistributionToolkit
using Dates
using Statistics
using CairoMakie
We will grab some country from the NaturalEarth database:
borders = getpolygon(PolygonData(NaturalEarth, Countries))
countries = FeatureCollection([borders[c] for c in ["Hungary", "Austria", "Slovenia", "Slovakia"]])
FeatureCollection with 4 features, each with 4 propertiesThe variable we are interested in is the average temperature in june:
spatial_extent = SpeciesDistributionToolkit.boundingbox(countries; padding=0.2)
dataprovider = RasterData(CHELSA2, AverageTemperature)
temperature = SDMLayer(dataprovider; month = Dates.Month(6), spatial_extent...)
🗺️ A 551 × 1652 layer with 910252 Float64 cells
Spatial Reference System: +proj=longlat +datum=WGS84 +no_defsWe remove everything that is not part of the four countries:
mask!(temperature, countries)🗺️ A 551 × 1652 layer with 423187 Float64 cells
Spatial Reference System: +proj=longlat +datum=WGS84 +no_defs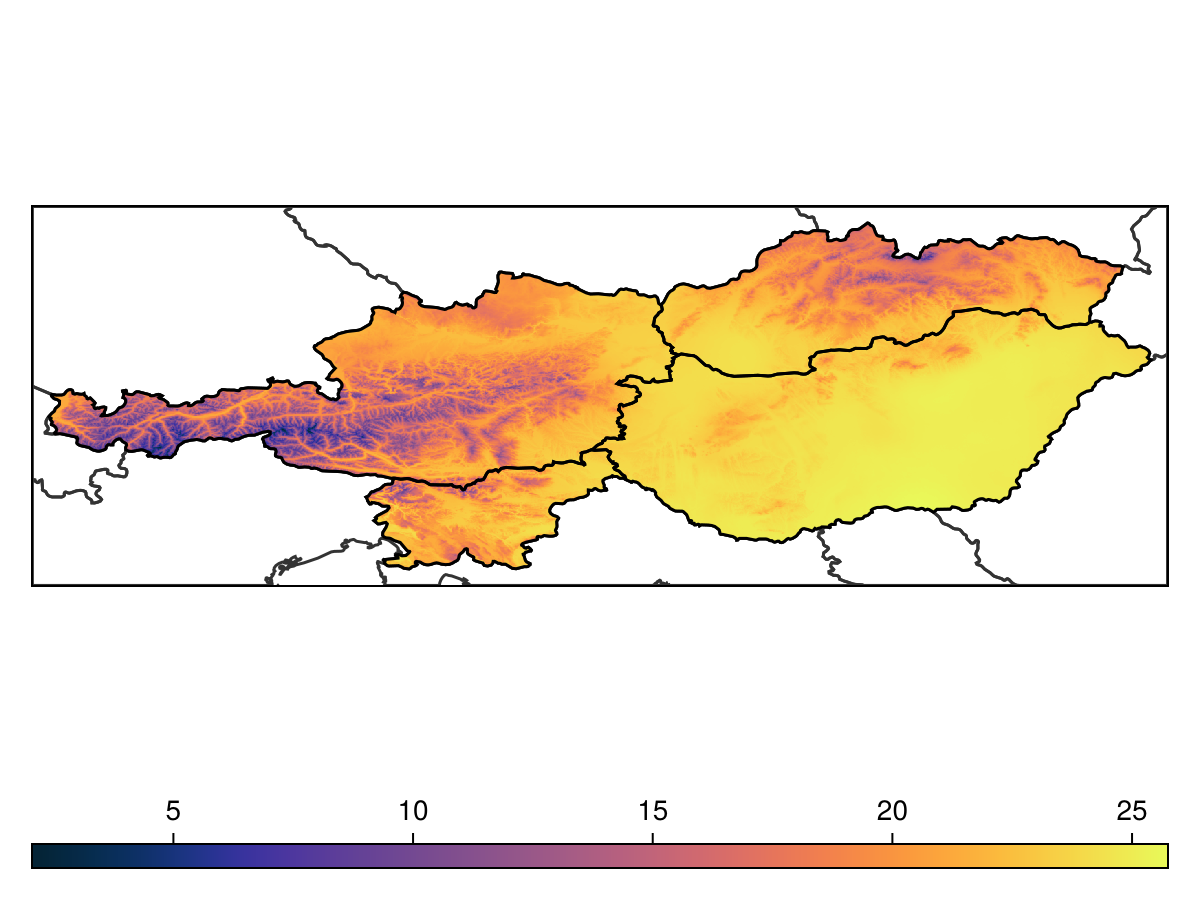
Code for the figure
f = Figure()
ax = Axis(f[1,1]; aspect=DataAspect())
lines!(ax, clip(borders, spatial_extent), color=:grey20)
hm = heatmap!(ax, temperature, colormap=:thermal)
tightlimits!(ax)
hidedecorations!(ax)
lines!(ax, countries, color=:black)
Colorbar(f[2,1], hm, vertical=false)
We can start looking at how the countries map onto the landscape, using the zone function. It will return a layer where the value of each pixel is the index of the polygon containing this pixel:
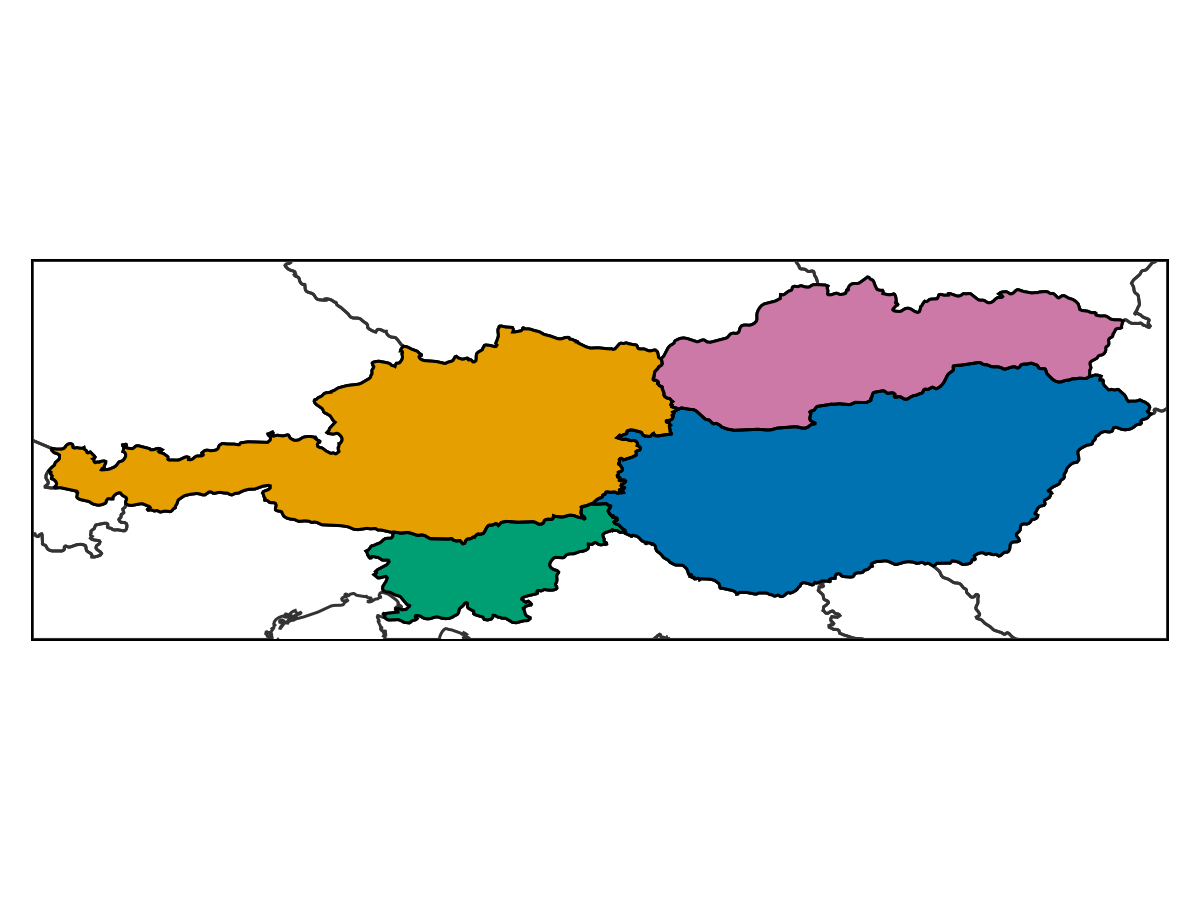
Code for the figure
f = Figure()
ax = Axis(f[1,1]; aspect=DataAspect())
lines!(ax, clip(borders, spatial_extent), color=:grey20)
cmap = cgrad(Makie.wong_colors()[1:length(countries)], length(countries), categorical=true)
heatmap!(ax, zone(temperature, countries); colormap = cmap)
tightlimits!(ax)
hidedecorations!(ax)
lines!(ax, countries, color=:black)
Note that the pixels that are not within a polygon are turned off, which can sometimes happen if the overlap between polygons is not perfect. There is a variant of the mosaic method that uses polygon to assign the values. Note that for a feature collection, it takes an extra argument which is the property on which the features are grouped.
zones = mosaic(mean, temperature, countries, "Name")
nodata!(zones, iszero)
🗺️ A 551 × 1652 layer with 423187 Float64 cells
Spatial Reference System: +proj=longlat +datum=WGS84 +no_defsFinally, we can get the mean value within each of these polygons using the byzone method:
warmest = sort(
    collect(byzone(mean, temperature, countries, "Name"));
    by = (x) -> x.second,
    rev = true,
)
4-element Vector{Pair{String, Float64}}:
"Hungary" => 24.217808481631838
"Slovenia" => 21.175171685155796
"Slovakia" => 20.707353079123948
"Austria" => 18.194914199589657The country with the warmest temperature value is
warmest = warmest[1].first"Hungary"We can finally highlight the warmest area:
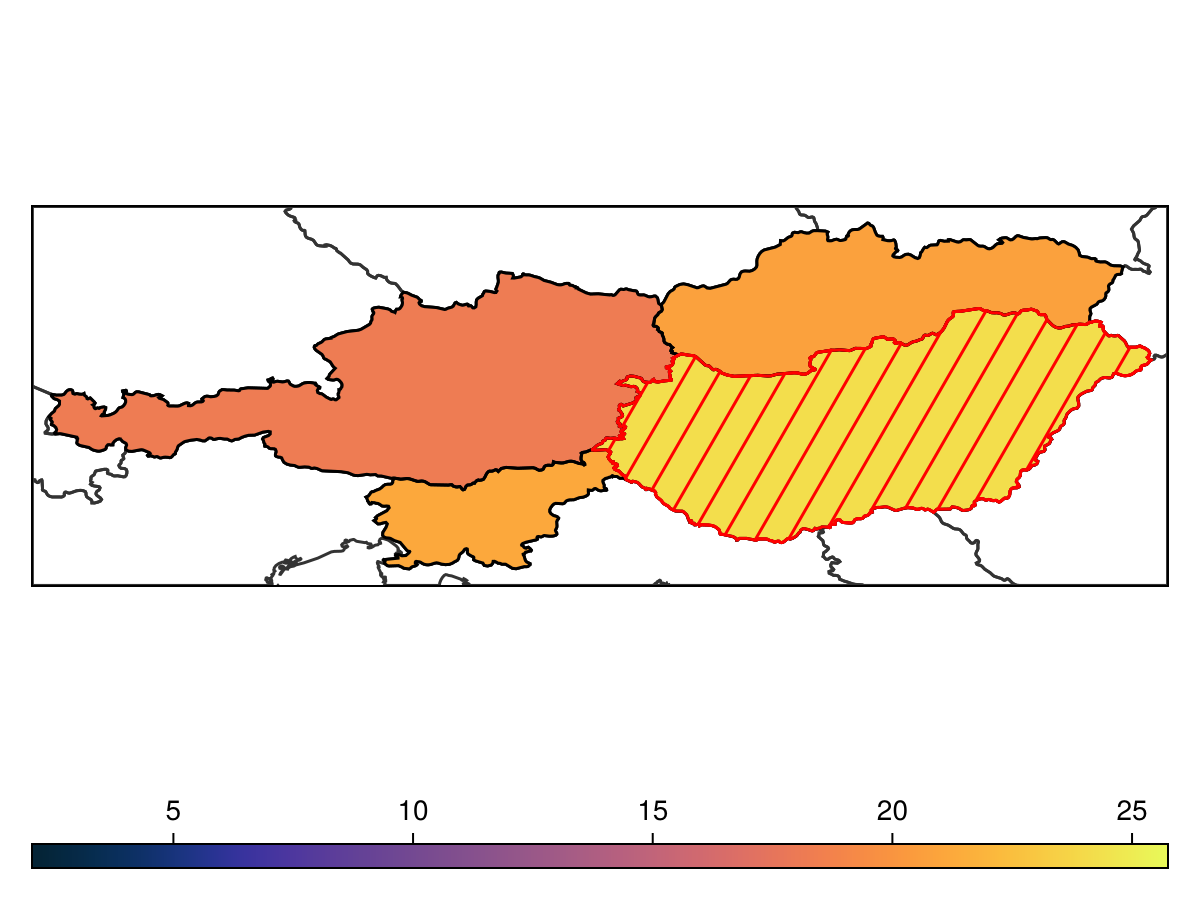
Code for the figure
f = Figure()
ax = Axis(f[1,1]; aspect=DataAspect())
lines!(ax, clip(borders, spatial_extent), color=:grey20)
hm = heatmap!(ax, zones, colormap=:thermal, colorrange=extrema(temperature))
tightlimits!(ax)
hidedecorations!(ax)
lines!(ax, countries, color=:black)
lines!(ax, crosshatch(countries[warmest], spacing=0.4), color=:red)
lines!(ax, countries[warmest], color=:red)
Colorbar(f[2,1], hm, vertical=false)