Interpreting models
The purpose of this vignette is to show how to generate explanations from SDeMo models, using partial responses and Shapley values.
using SpeciesDistributionToolkit
using PrettyTables
using Statistics
using CairoMakie
We will work on the demo data:
X, y, C = SDeMo.__demodata()
model = SDM(RawData, Logistic, X, y)
hyperparameters!(classifier(model), :interactions, :self)
variables!(model, StrictVarianceInflationFactor{10.0}; included = [1])
variables!(model, ForwardSelection; included = [1])
☑️ RawData → Logistic → P(x) ≥ 0.548Model explanations require a trained model, a choice of an explanation method (PartialResponse or CeterisParibus, as well as PartialDependence), and additional arguments to decide where the responses will be predicted. These functions work on either one or two variables.
Partial responses
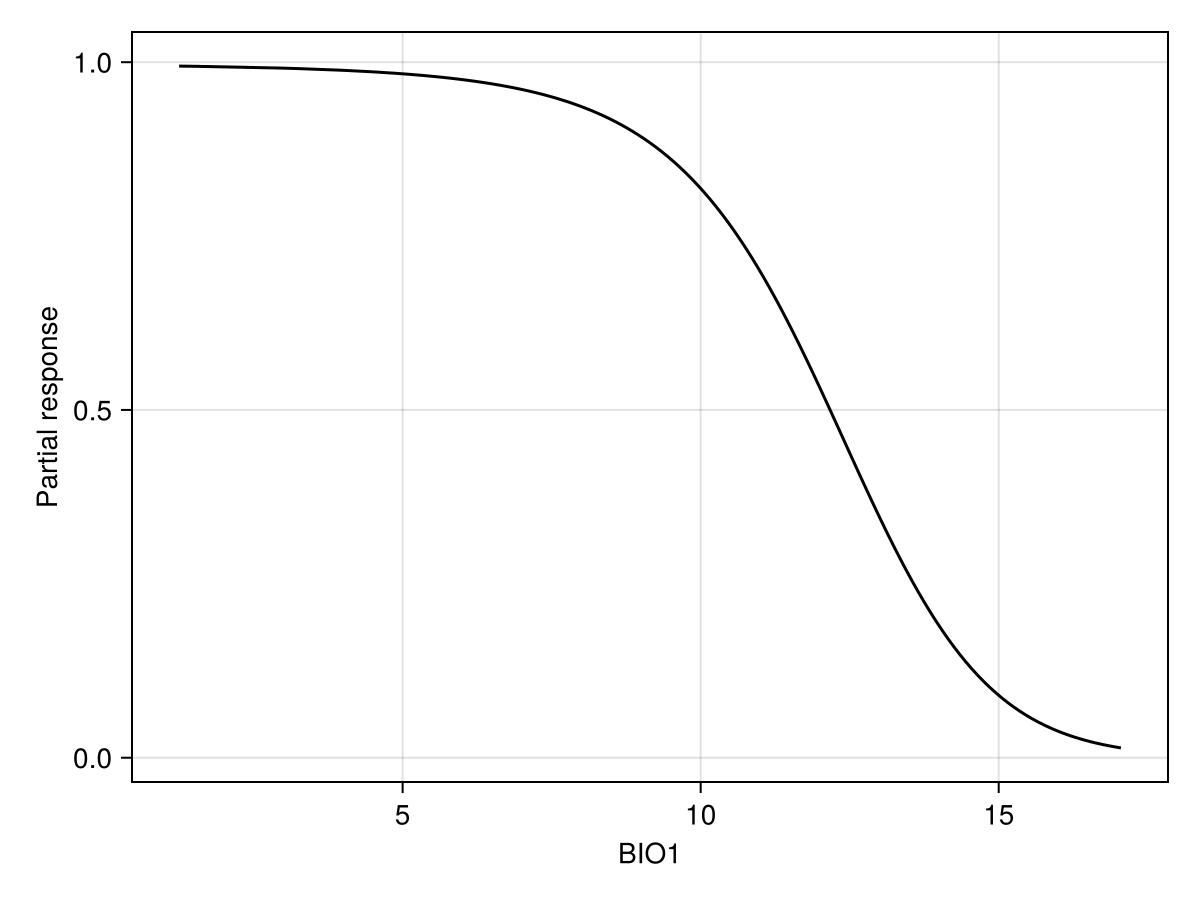
Partial responses work by setting the value of all variables to their average value, and then varying the value of the variable of interest on a given range of values. It allows to examine how the model is reacting to a change in a focal variable, in the context of the average value of all other variables.
px, py = explainmodel(PartialResponse, model, 1; threshold = false);The order of arguments is always the type of response, then the model, then the variable(s). Some methods also have a
Note that we use threshold=false to make sure that we look at the score that is returned by the classifier, and not the thresholded version (i.e. presence/absence). When called with no arguments, the explainmodel function will evaluate at each unique value of the predictor layer.
Code for the figure
f = Figure()
ax = Axis(f[1, 1]; xlabel = "BIO1", ylabel = "Partial response")
lines!(ax, px, py; color = :black)
Alternatively, we can set the number of equally spaced steps to use:
px, py = explainmodel(PartialResponse, model, 1, 15; threshold = false);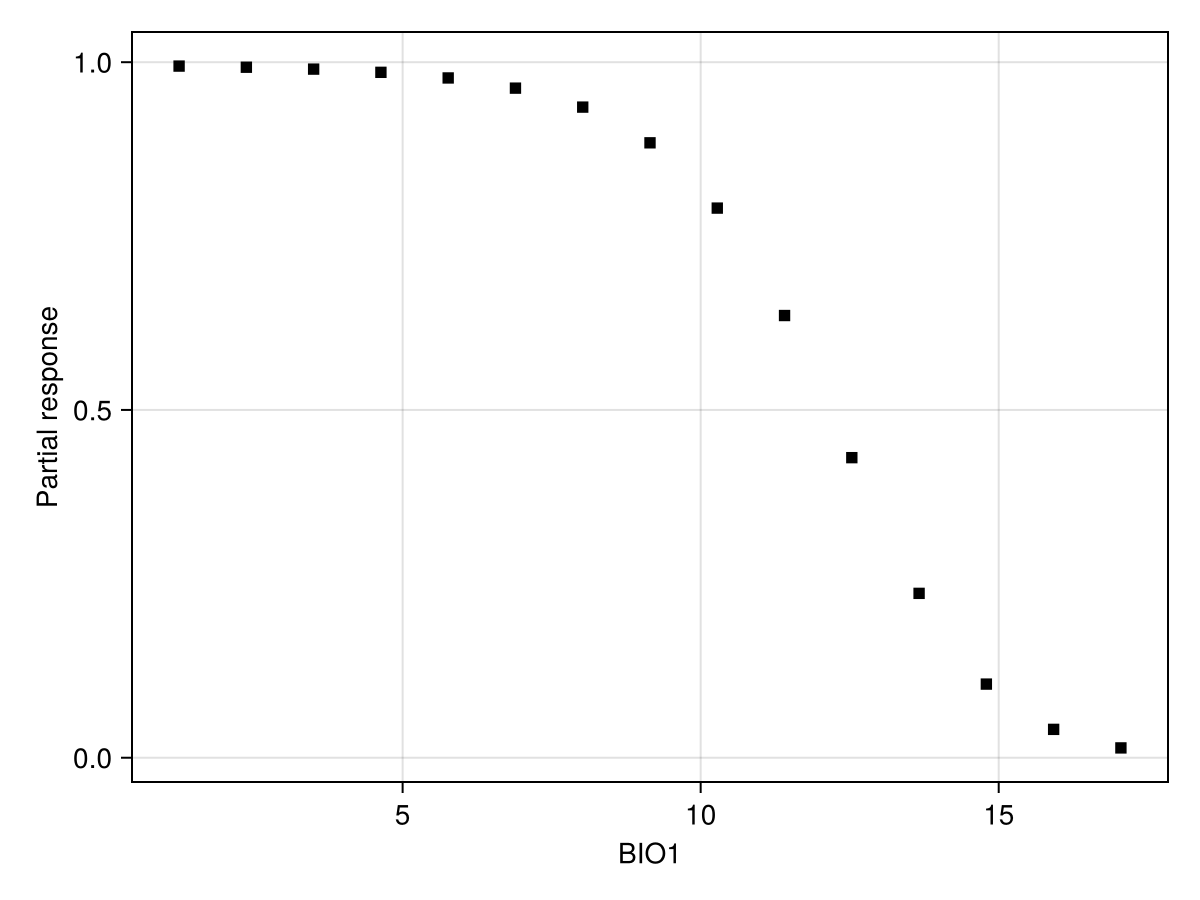
Code for the figure
f = Figure()
ax = Axis(f[1, 1]; xlabel = "BIO1", ylabel = "Partial response")
scatter!(ax, px, py; color = :black, marker = :rect)
We can also look at a series of user-defined values:
x = quantile(features(model, 1), 0.0:0.02:1.0)
px, py = explainmodel(PartialResponse, model, 1, x; threshold = false);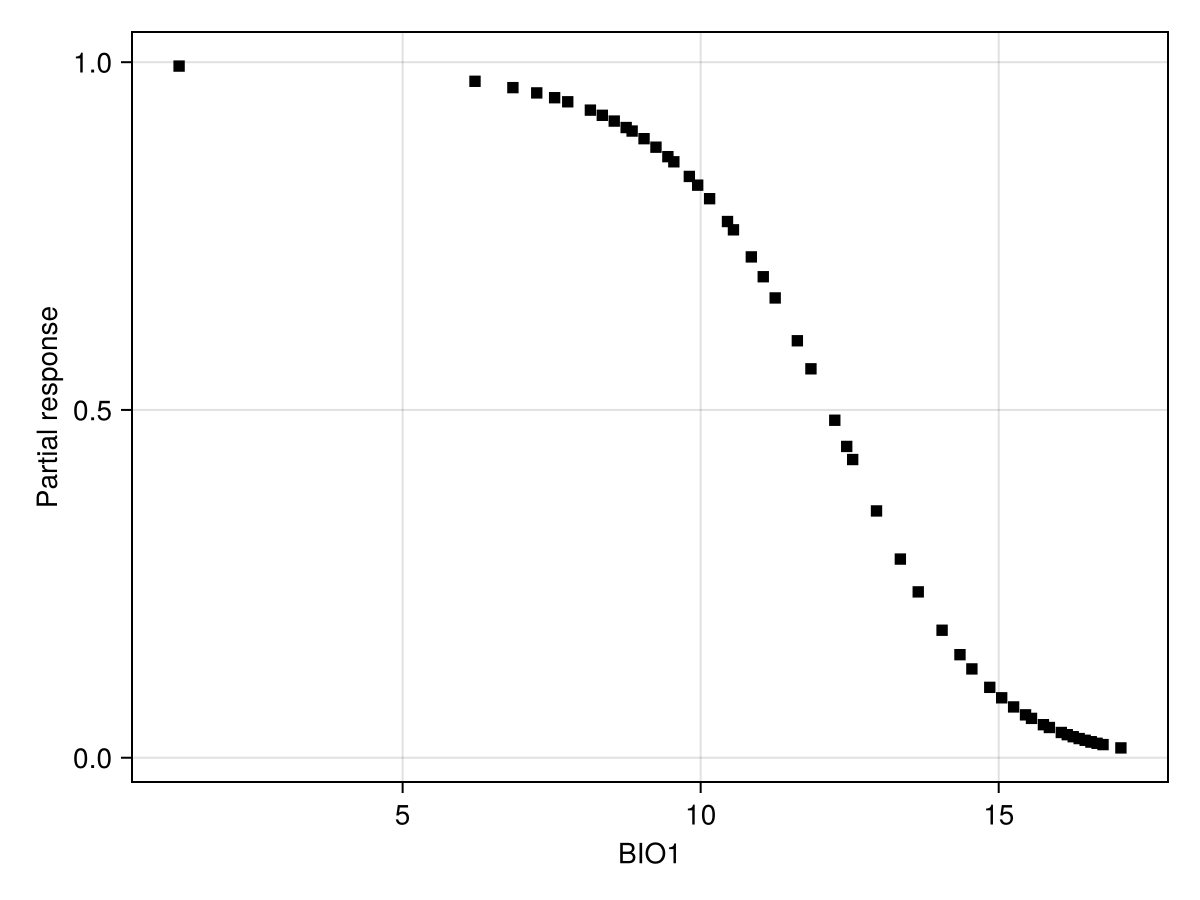
Code for the figure
f = Figure()
ax = Axis(f[1, 1]; xlabel = "BIO1", ylabel = "Partial response")
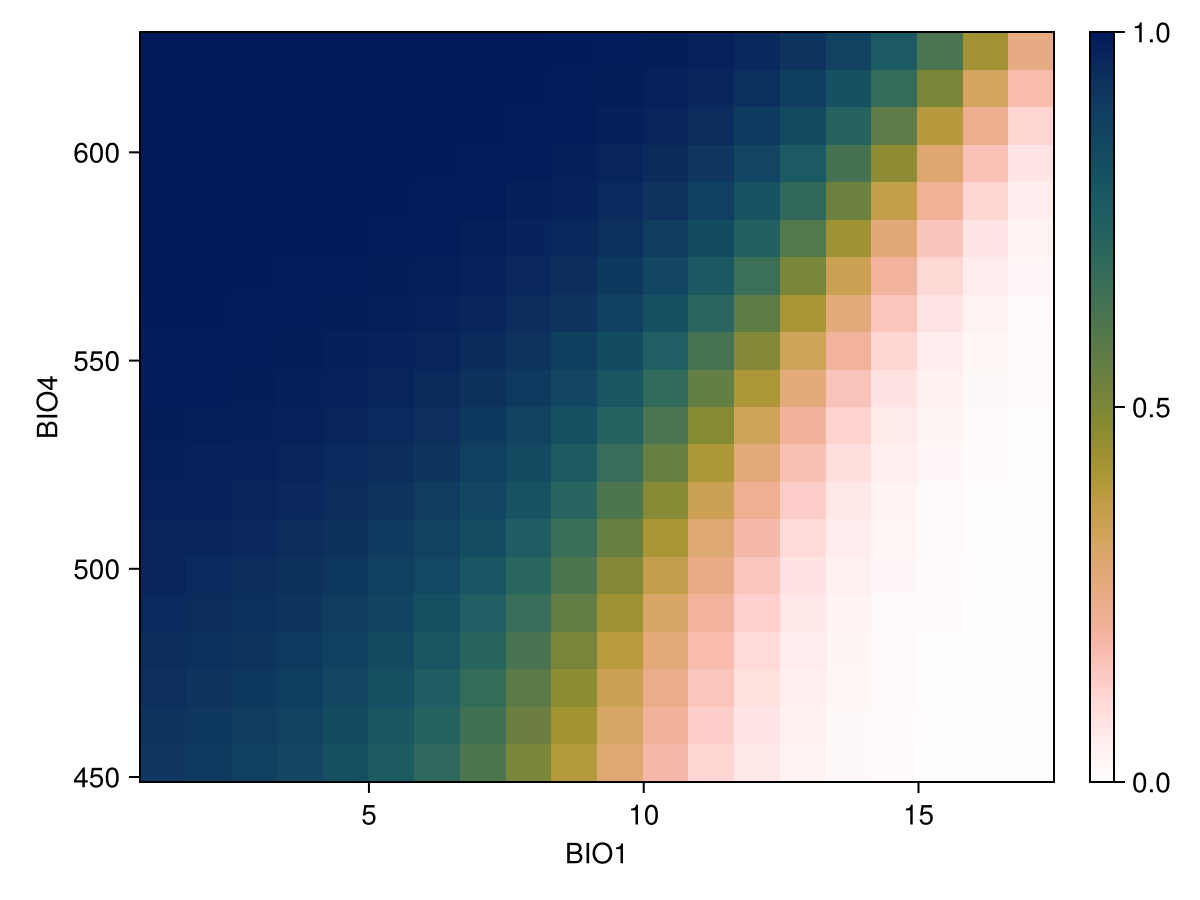
scatter!(ax, px, py; color = :black, marker = :rect)We can also show the response surface using two variables:
vars = (variables(model)[1], variables(model)[2])
px, py, pz = explainmodel(PartialResponse, model, vars, 20; threshold = false);
Note that the last element returned in this case is a two-dimensional array, as it makes sense to visualize the result as a surface.
Code for the figure
f = Figure()
ax = Axis(
    f[1, 1];
    xlabel = "BIO$(variables(model)[1])",
    ylabel = "BIO$(variables(model)[2])",
)
cm = heatmap!(px, py, pz; colormap = Reverse(:batlowW), colorrange = (0, 1))
Colorbar(f[1, 2], cm)
Inflated partial responses replace the average value by other values drawn at random from the pool of existing variables:
px, py = explainmodel(PartialResponse, model, vars, 10; inflated = true, threshold = false);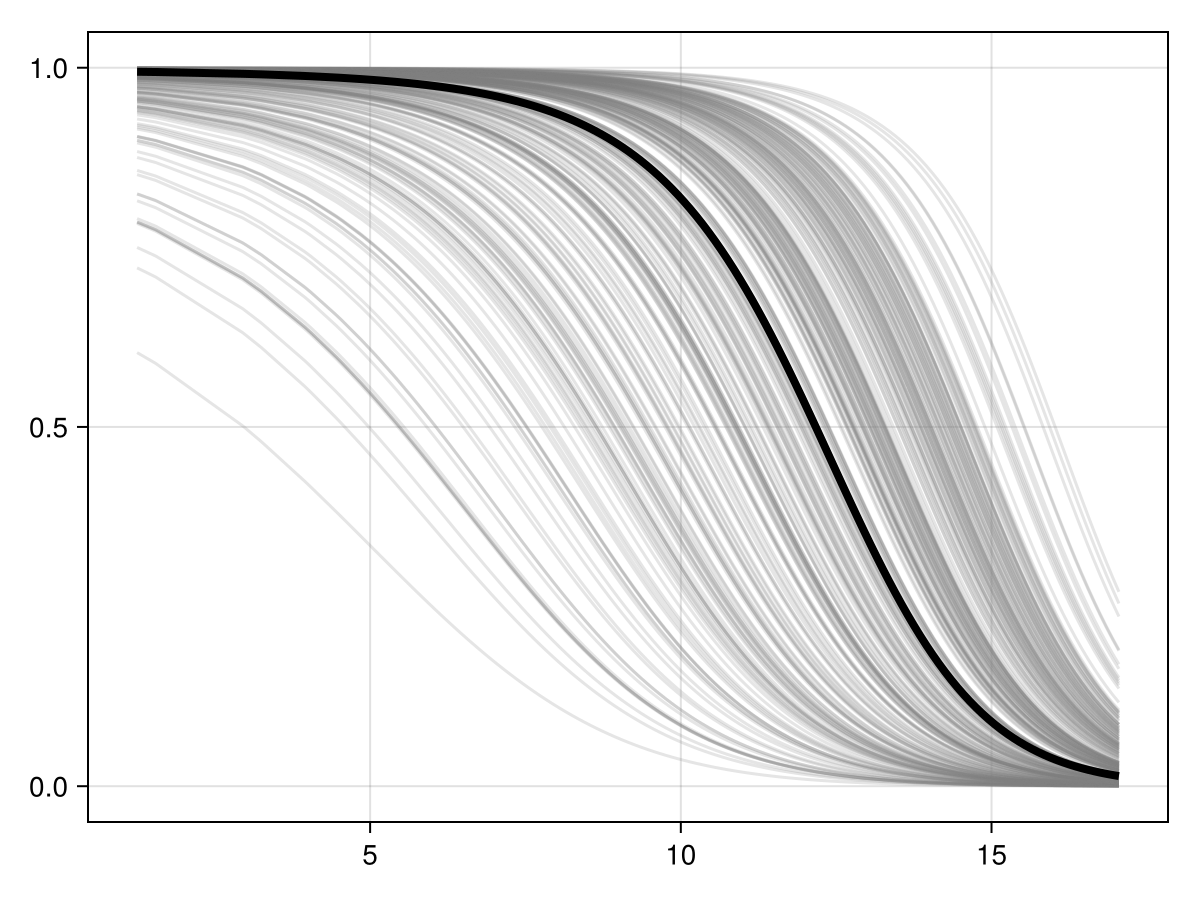
Code for the figure
f = Figure()
ax = Axis(f[1, 1])
px, py = explainmodel(PartialResponse, model, 1; inflated = false, threshold = false)
for i in 1:300
    ix, iy = explainmodel(PartialResponse, model, 1; inflated = true, threshold = false)
    lines!(ax, ix, iy; color = (:grey, 0.2))
end
lines!(ax, px, py; color = :black, linewidth = 4)
Ceteris paribus plots
CP plots are for a single instance by keeping non focal variables and then replace by all values of the focal variable(s)
px, py = explainmodel(CeterisParibus, model, 1, 1, 50; threshold = false);Additional argument
The CP plot explanation requires an additional argument, which is the position of the instance at which the response must be evaluated. The order of arguments is model, then variable, then instance.
Note that we use threshold=false to make sure that we look at the score that is returned by the classifier, and not the thresholded version (i.e. presence/absence). When called with no arguments, the explainmodel function will evaluate at each unique value of the predictor layer.
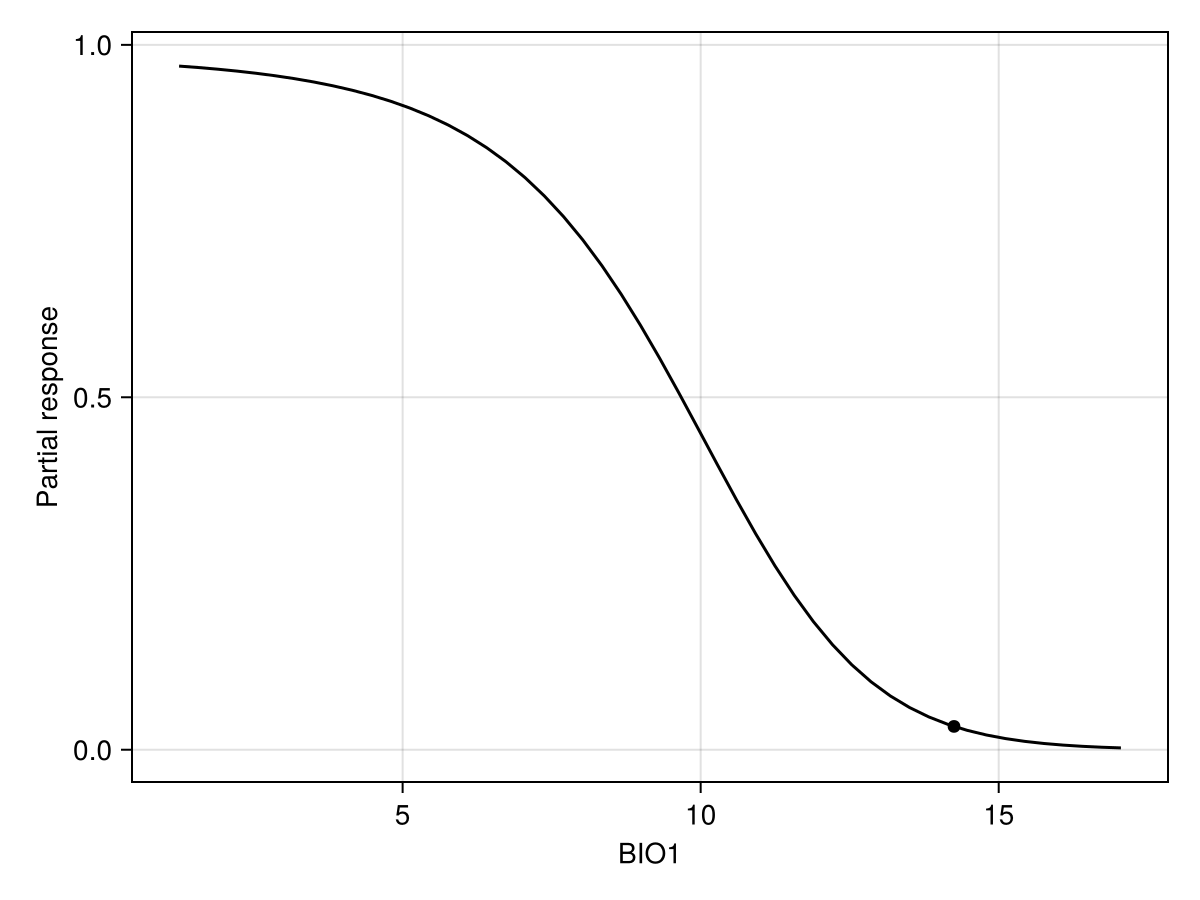
Code for the figure
f = Figure()
ax = Axis(f[1, 1]; xlabel = "BIO1", ylabel = "Partial response")
scatter!(
    ax,
    [features(model, 1)[1]],
    [predict(model; threshold = false)[1]];
    color = :black,
)
lines!(ax, px, py; color = :black)
We can also do this for two variables at a time
px, py, pz = explainmodel(CeterisParibus, model, vars, 1, 20; threshold = false);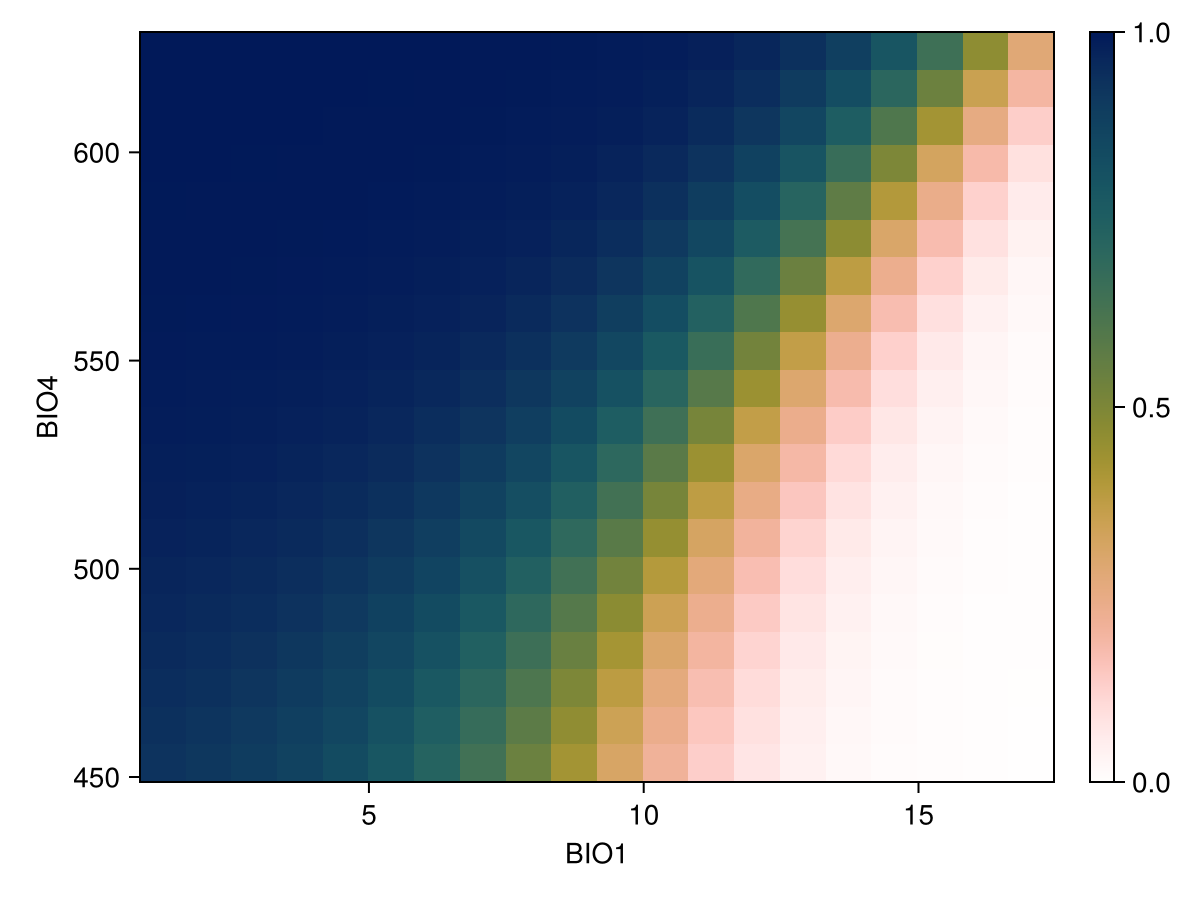
Code for the figure
f = Figure()
ax = Axis(
    f[1, 1];
    xlabel = "BIO$(variables(model)[1])",
    ylabel = "BIO$(variables(model)[2])",
)
cm = heatmap!(px, py, pz; colormap = Reverse(:batlowW), colorrange = (0, 1))
Colorbar(f[1, 2], cm)
Individual conditional expectations
The ICE plot is quite simply all of the CP plots at the same time. Here, instances that are positive in the training data are in purple.
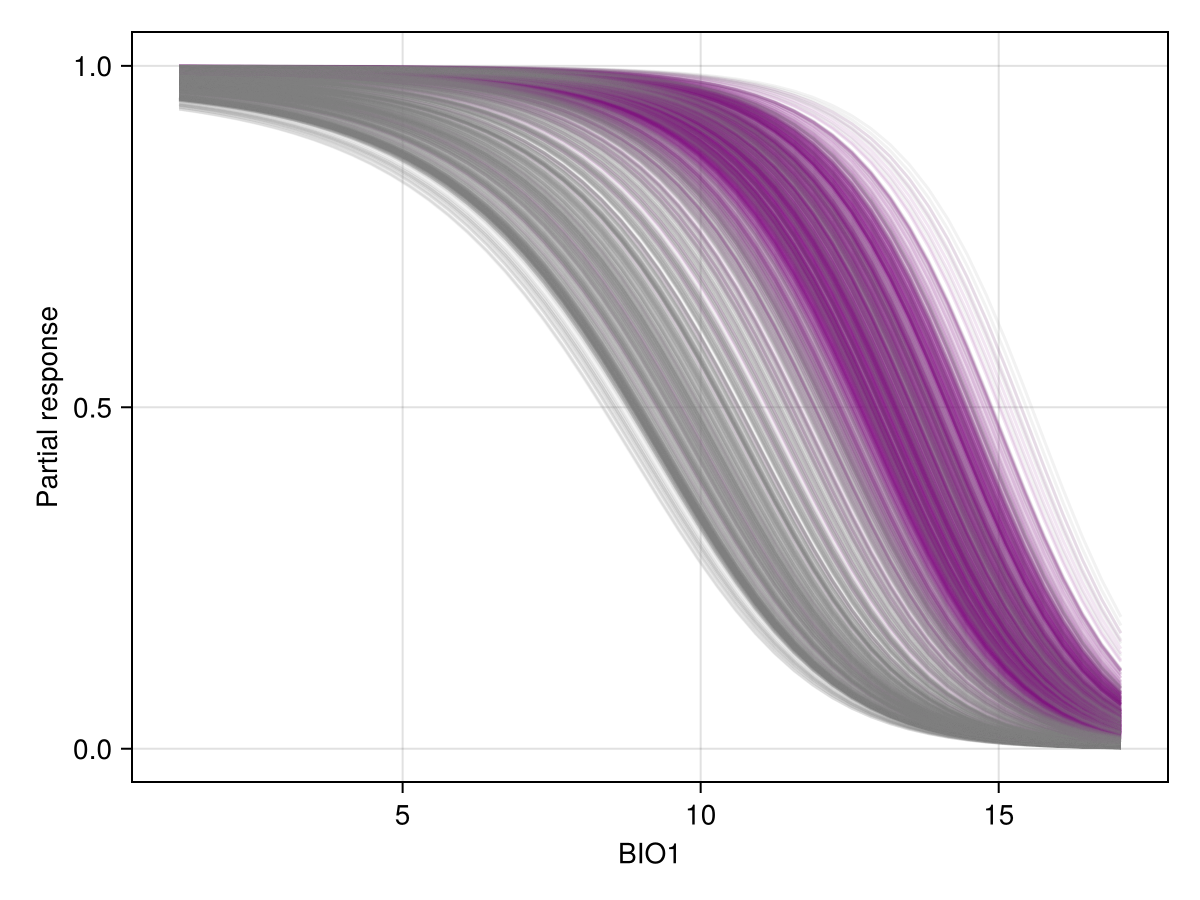
Code for the figure
f = Figure()
ax = Axis(f[1, 1]; xlabel = "BIO1", ylabel = "Partial response")
for (i, l) in enumerate(labels(model))
    col = l ? :purple : :grey50
    lab = l ? "Presences" : "Absences"
    lines!(
        ax,
        explainmodel(CeterisParibus, model, 1, i, 50; threshold = false)...;
        color = col,
        alpha = 0.1,
    )
end
Partial dependence plot
The partial dependence plot is the average of all CP plots.
px, py = explainmodel(SDeMo.PartialDependence, model, 1, 50; threshold = false);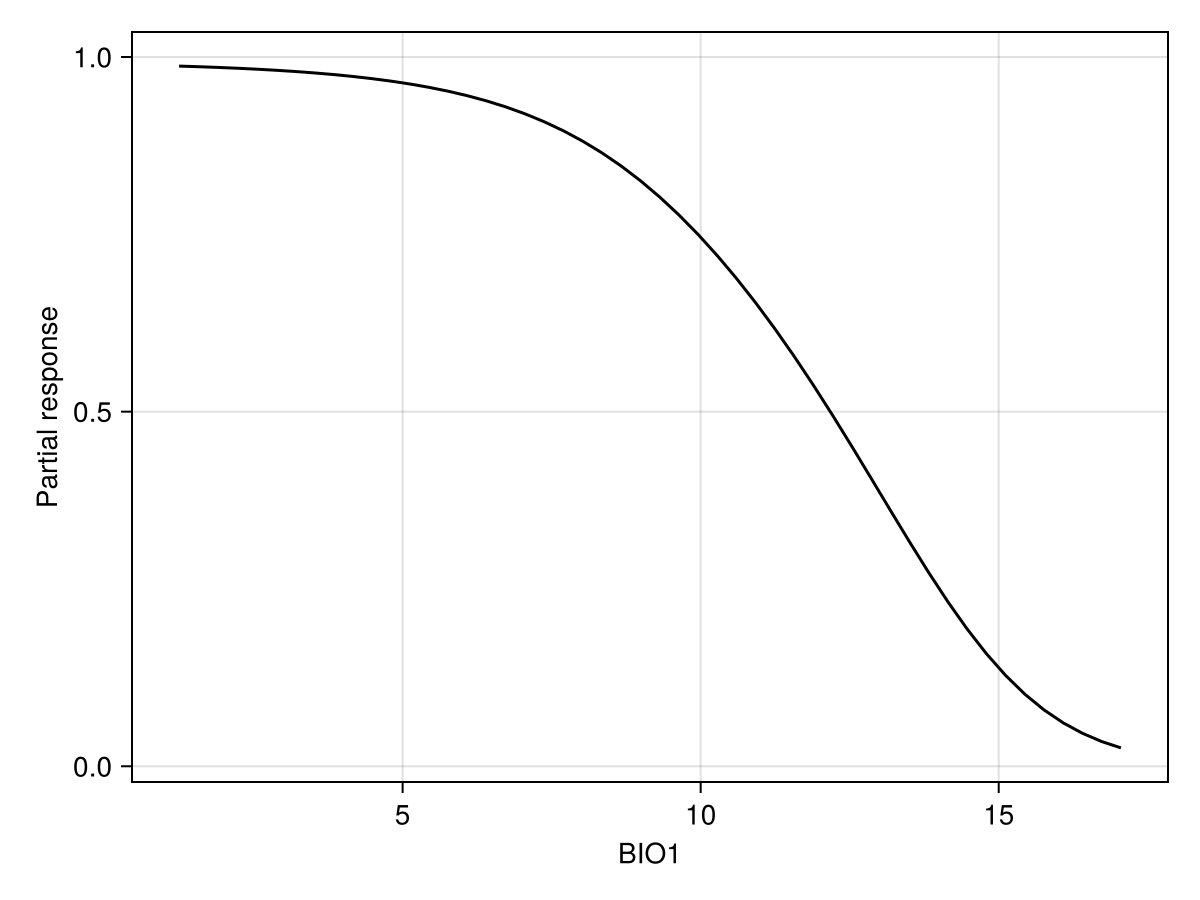
Code for the figure
f = Figure()
ax = Axis(f[1, 1]; xlabel = "BIO1", ylabel = "Partial response")
lines!(ax, px, py; color = :black)
We can also produce it for two variables, using the same syntax as before. Note that in this case, we look at the prediction of the model with a threshold, so the resulting plot will indicate how strongly the model would predict the presence of the species for a pair of values of these two variables:
px, py, pz = explainmodel(SDeMo.PartialDependence, model, vars, 100; threshold = true);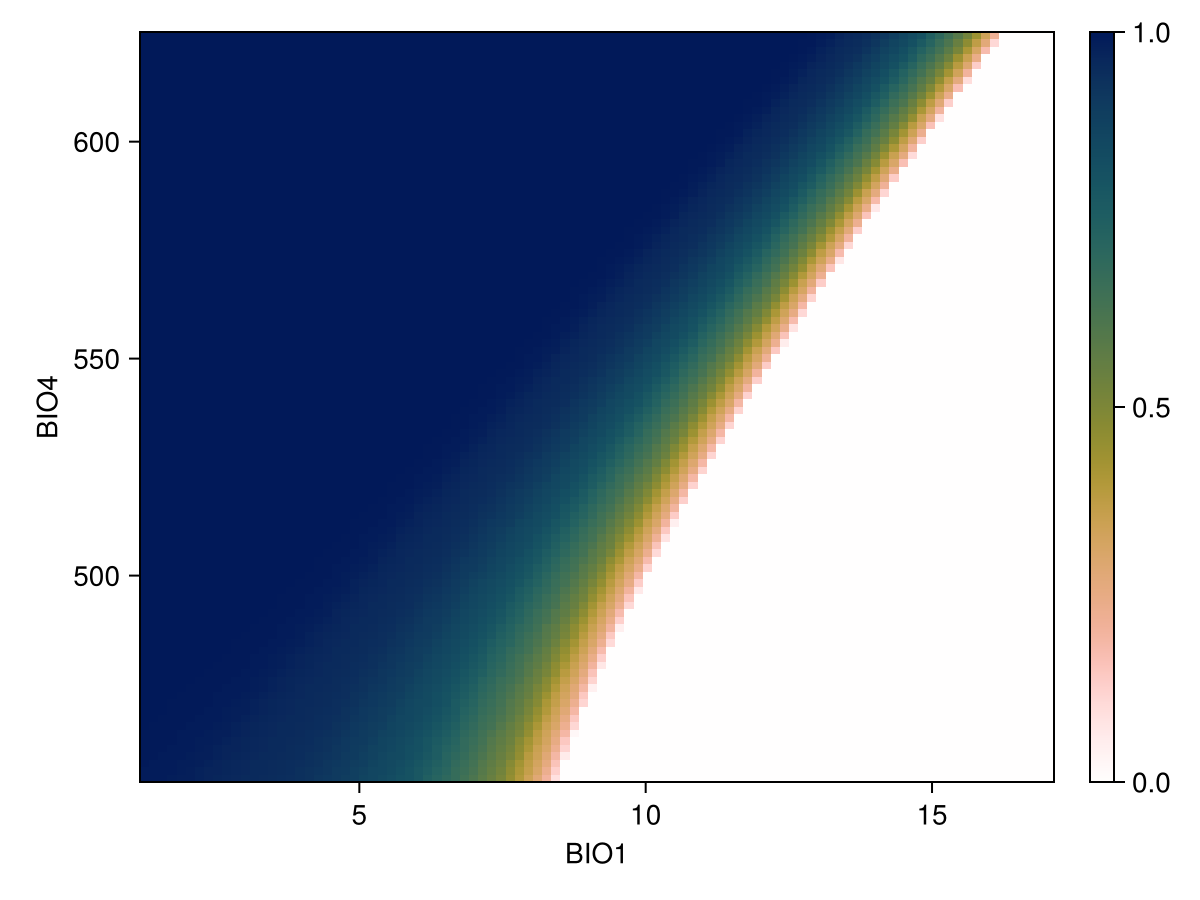
Code for the figure
f = Figure()
ax = Axis(
    f[1, 1];
    xlabel = "BIO$(variables(model)[1])",
    ylabel = "BIO$(variables(model)[2])",
)
cm = heatmap!(px, py, pz; colormap = Reverse(:batlowW), colorrange = (0, 1))
Colorbar(f[1, 2], cm)
Feature importance
The partial dependence curve also serves as a measure of feature importance, as explained in the relevant vignette.
Shapley values
We can perform the (MCMC version of) Shapley values measurement, using ShapleyMC as the first argument to explainmodel. For example, we can check how much the prediction for the third instance was shifted by the value of the first variable:
feat, inst = 1, 3
explainmodel(ShapleyMC, model, feat, inst)
(10.05, 0.305)As for all other explainmodel methods, the results are returned as a tuple with the feature value, and the response.
Interpretation of Shapley values
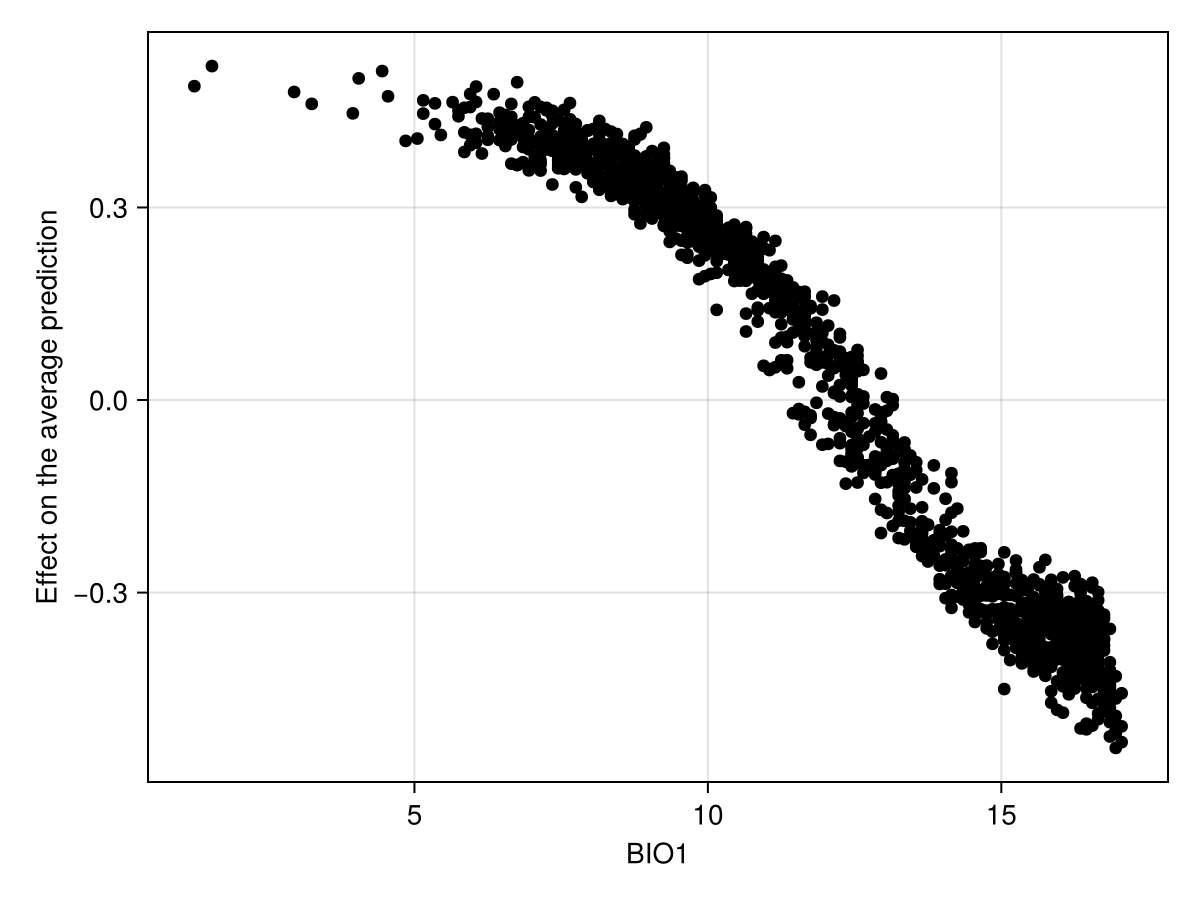
The Shapley values measure the difference to the average prediction, and so they exist on a different scale compared to the other responses we have seen in this vignette.
We can also produce a figure that looks like the partial response curve, by showing the effect of a variable on each training instance:
Code for the figure
f = Figure()
ax = Axis(f[1, 1]; xlabel = "BIO1", ylabel = "Effect on the average prediction")
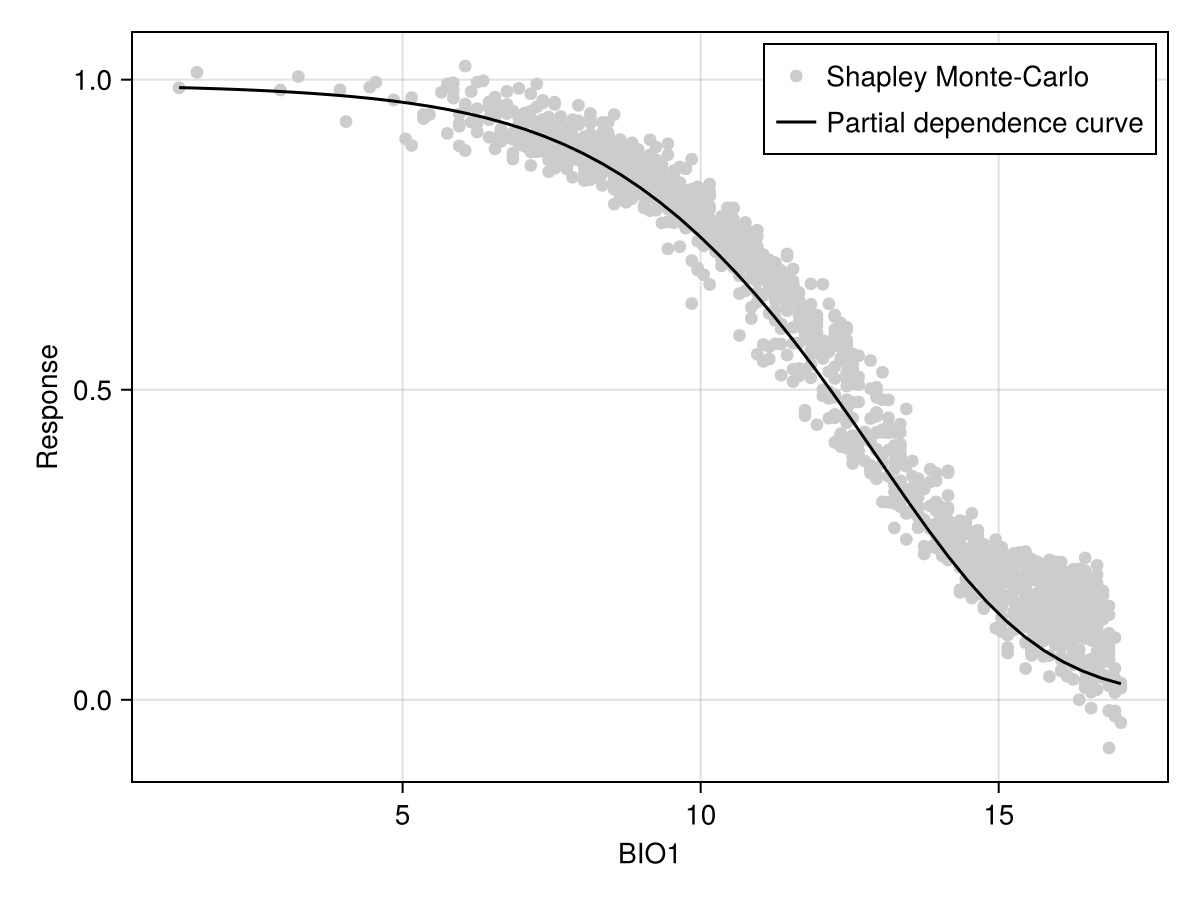
scatter!(ax, explainmodel(ShapleyMC, model, 1; threshold = false)...; color = :black)To facilitate the comparison with other approaches, it may be useful to add the average prediction of the model (on the training dataset):
Code for the figure
f = Figure()
ax = Axis(f[1, 1]; xlabel = "BIO1", ylabel = "Response")
sx, sy = explainmodel(ShapleyMC, model, 1; threshold = false)
sy .+= mean(predict(model; threshold = false))
scatter!(ax, sx, sy; color = :grey80, label = "Shapley Monte-Carlo")
lines!(
    ax,
    explainmodel(PartialDependence, model, 1, 50; threshold = false)...;
    color = :black,
    label = "Partial dependence curve",
)
axislegend(ax)
Shapley values are also useful because they can provide an explanation for the actual prediction. For example:
expl = [last(explainmodel(ShapleyMC, model, v, 1)) for v in variables(model)]3-element Vector{Float64}:
-0.38
-0.2
0.075Related documentation
SDeMo.explainmodel Function
explainmodel(ModelExplanation, model, variable::Tuple{Int,Int}, n::Int; kwargs...)Generates an n by n grid to measure the surface representing the joint explanation for two variables. ModelExplanation is any type that can be used as the first argument for explainmodel. Other kwargs... are passed to explainmodel.
explainmodel(ModelExplanation, model, variable::Tuple{Int,Int}, n::Int; kwargs...)Generates a grid to measure the surface representing the joint explanation for two variables, where the entries of the grid are the sorted unique values for the pair of variables to consider. ModelExplanation is any type that can be used as the first argument for explainmodel. Other kwargs... are passed to explainmodel.
explainmodel(ModelExplanation, model, variable::Int, n::Int; kwargs...)Generates n equally spaced values over the range of values for the variable of interest, on which the requested explanation will be measured. ModelExplanation is any type that can be used as the first argument for explainmodel. Other kwargs... are passed to explainmodel.
explainmodel(ModelExplanation, model, variable::Int, n::Int; kwargs...)Sorts the unique values for the variable of interest, on which the requested explanation will be measured. ModelExplanation is any type that can be used as the first argument for explainmodel. Other kwargs... are passed to explainmodel.
explainmodel(PartialResponse, model, variable, x; inflated=false, kwargs...)Returns the partial response of the model for a given variable, which is evaluated at all values given by x. The partial response is the prediction made using the given value of variable, when all other variables take the average value. When inflated is true, the response is measured against a randomly sampled value in the entire range of possible values for the other variables.
The result is returned as a tuple x, response.
All other kwargs... are passed to predict.
explainmodel(PartialResponse, model, variable, x, y; inflated=false, kwargs...)Returns the partial response of the model for a given pair of variable given as a tuple, which are evaluated at all values given by vectors x and y.
The result is returned as a tuple x, y, response.
All other kwargs... are passed to predict.
explainmodel(CeterisParibus, model, variable, index, x; kwargs...)Returns the ceteris paribus explanation for a given instance (given as an index: the n-th instance of the model) and a given variable, whose values are evaluated at all positions in the vector x.
Additional kwargs... are passed to predict.
This function returns a tuple x, response.
explainmodel(CeterisParibus, model, variable, index, x, y; kwargs...)Returns the ceteris paribus explanation for a given instance (given as an index: the n-th instance of the model) and a given variable pair, whose values are evaluated at all positions in the vectors x and `y.
Additional kwargs... are passed to predict.
This function returns a tuple x, y, response, where the response is a matrix.
explainmodel(CeterisParibus, model, variable, index, n; kwargs...)Returns the ceteris paribus explanation for a given instance (given as an index: the n-th instance of the model) and a given variable, whose values are evaluated at n equally spaced positions across the range of the variable in the training data.
Additional kwargs... are passed to predict.
This function returns a tuple x, response.
explainmodel(CeterisParibus, model, variable, index; kwargs...)Returns the ceteris paribus explanation for a given instance (given as an index: the n-th instance of the model) and a given variable, whose values are evaluated at all the (sorted) unique values of the variable in the training data.
Additional kwargs... are passed to predict.
This function returns a tuple x, response.
explainmodel(CeterisParibus, model, variable::Tuple{Int,Int}, index, n; kwargs...)Returns the ceteris paribus explanation for a given instance (given as an index: the n-th instance of the model) and a given variable pair, whose values are evaluated at n evenly spaced position across the range of both variables.
Additional kwargs... are passed to predict.
This function returns a tuple x, y, response, where the response is a matrix.
explainmodel(CeterisParibus, model, variable::Tuple{Int,Int}, index; kwargs...)Returns the ceteris paribus explanation for a given instance (given as an index: the n-th instance of the model) and a given variable pair, whose values are evaluated at the (sorted) unique pairs of both variables.
Additional kwargs... are passed to predict.
This function returns a tuple x, y, response, where the response is a matrix.
explainmodel(PartialDependence, model, variable, x; kwargs...)Returns the partial dependence curve of the model for a given variable, which is evaluated at all values given by x.
The result is returned as a tuple x, response.
All other kwargs... are passed to predict.
explainmodel(PartialDependence, model, variable::Tuple{Int, Int}, x, y; kwargs...)Returns the partial dependence curve of the model for a given pair of variables, which is evaluated at all values given by x and y.
The result is returned as a tuple x, y, response.
All other kwargs... are passed to predict.
explainmodel(ShapleyMC, model, variable::Int; kwargs...)Returns the Shapley values (approximation) for the given variable. All other arguments are passed to predict.
The result is returned as a tuple feature, explanation.
explainmodel(ShapleyMC, model, variable::Int, index::Int; kwargs...)Returns the Shapley values (approximation) for the given variable for the given index observation. All other arguments are passed to predict.
The result is returned as a tuple feature, explanation.
explainmodel(ShapleyMC, model, variable::Int, X::Matrix; kwargs...)Returns the Shapley values (approximation) for the given feature matrix X.
explainmodel(ModelExplanation, model, variable, layers; kwargs...)Returms a layer with the explanation of the effect of a given variable, provided by either PartialDependence, PartialResponse, or ShapleyMC.
Note that PartialDependence may take longer to run, as it will run the CeterisParibus explanations for all the training instances at every point in the raster.
All other kwargs... are passed to explainmodel.
explainmodel(ModelExplanation, model, variable, layers; kwargs...)Returms a vector of layers with the explanations for the effect of all variables, provided by either PartialDependence, PartialResponse, or ShapleyMC.
Note that PartialDependence may take longer to run, as it will run the CeterisParibus explanations for all the training instances at every point in the raster.
All other kwargs... are passed to explainmodel.
SDeMo.CeterisParibus Type
CeterisParibusThis type is used as the first argument of explainmodel to generate data the ceteris paribus curve for a single observation. The ceteris paribus response is measured by maintaining the value of all other variables, and measuring the model prediction on all possible values of the variable of interest. The superposition of all ceteris paribus curves is the individual conditional expectation plot.
SDeMo.PartialResponse Type
PartialResponseThis type is used as the first argument of explainmodel to generate a partial response curve. Using the inflated Boolean keyword of explainmodel will generate the inflated partial response.
SDeMo.ShapleyMC Type
ShapleyMCThis type is used as the first argument of explainmodel to generate an explanation based on the Monte-Carlo approximation of Shapley values.
This type can also be used as the first argument of featureimportance, to measure the variation based on the absolute change created by each variable.
SDeMo.PartialDependence Type
PartialDependenceThis type is used as the first argument of explainmodel to generate data for the partial dependence plot, which is the mean of all the individual conditional expectations, themselves generated with CeterisParibus.
This type can also be used as the first argument of featureimportance, to measure the variation within the partial dependence curve as a proxy for the importance of a feature.
SDeMo.ModelExplanation Type
ModelExplanationThis abstract type collects the various types that can be used to generate model explanations. This is currently PartialResponse, CeterisParibus, ShapleyMC, and PartialDependence.