TK rework this paragraph: need to predict host-virus associations
The current pandemic of SARS-CoV-2 is a stark reminder that movement of viruses through novel animal hosts, and ultimately to human through zoonotic spillovers (Plowright et al. 2017), requires that we understand the complexity of our biological surroundings. Indeed, the fact that the majority of emerging infectious diseases are caused by zoonotic pathogens from wildlife sources (Jones et al. 2008) gives some urgency to the task of predicting which viruses can be found in which hosts, so as to provide guidance on where and what species to sample and where spillovers are likely to happen (Johnson et al. 2020; Albery et al. 2020).
As seen with SARS-CoV and MERS-CoV epidemics, novel human infections by viruses are representing a serious threat to global public health, and being able to prevent future viral emergence now appears as a fundamental tool among our society. Zoonotic dynamics usually involve three main stages: transmission within the animal reservoir, cross-species spillover and transmission to human, and finally, transmission among humans (Lloyd-Smith et al. 2009). In the past decades, substantial research effort has been put in studying and predicting dynamics at the animal-human interface, but tracing back the ultimate origin of novel zoonotic viruses remains a major difficulty (Becker et al. 2020). Also, the main strategy adopted so far against infectious diseases consists in taking actions after the emergence by increasing the health infrastructures and vigilance, as well as developing vaccines or medical treatments (Han and Drake 2016).
As suggested by Han and Drake (2016), a more efficient approach would be anticipatory. Yet an anticipatory approach can be limited by lack of suitable data, and as Becker et al. (2020) highlighted, by disagreement between models. The task of predicting possible host-virus interactions would therefore benefit from adding methods that allow imputation, and can produce results that are easily added to ensemble models. Here, we explore an approach focusing on the first stage of zoonoses dynamics, by using the Singular Value Decomposition (SVD) as an imputation method for identifying unobserved host-virus interactions, acting as potential intermediate hosts in diseases transmissions.
TK SVD is a way to do link prediction in the absence of external information, but we can rely on info contained in the network itself
TK main results: optimal rank, number of new associations, top 10 zoonoses
Dataset
TK this actually uses CLOVER now
We apply SVD imputation to the data on wildlife hosts of beta-coronaviruses collected by Becker et al. (2020). This host-virus network is composed of 710 mammalian hosts (resolved at the species level) and 72 viruses (resolved at the genus level). Full data are available from https://github.com/viralemergence/virionette/. While the host-virus interaction have been pulled from published sources, specific attention has been paid to betacoronaviruses, a viral genus at high risk of spillover, and to their potential bat hosts, a mammalian order known to be evolutionary involved in the main viruses zoonotic historical epidemics (Shipley et al. 2019; Ren et al. 2006). Data on interactions between these groups were augmented by a GenBank search to retrieve the hosts associated to sequences of betacoronaviruses. Altogether, this dataset represents a total of 1731 unique interactions, and 49389 host-virus pairs for which no interaction were reported; these can be true negatives (the virus is unable to infect the host), or false negatives (the virus can infect the host but the infection has not been reported). This type of problem lends itself well to an approach using a recommender system.
The model
We ran all analyses in Julia 1.5.3 (Bezanson et al. 2017), on the Beluga supercomputer operated by the Calcul Québec consortium.
Low-rank approximation with Singular Value Decomposition
Singular Value Decomposition (SVD; Gene H. Golub and Reinsch 1971; Forsythe and Moler 1967) is a linear algebra technique used to decompose a data matrix in a product of three matrices:
X = UΣVT (1)
Where X is a m × n data matrix (m ≥ n), U is an unitary m × m matrix containing the left singular vectors, V is an unitary n × n matrix containing the right singular vectors and Σ is a diagonal matrix containing the singular values ordered in decreasing order of importance, in regard of the quantity of information that they present. This process allows data reduction by finding key correlations among entries and then by approximating the original matrix.
Optimal truncation of the SVD at rank r (Eckart and Young 1936; G. H. Golub, Hoffman, and Stewart 1987) of the singular values will allow data reduction while keeping enough information to obtain a balance between complexity and accuracy within the model. Truncation at rank r was performed by setting values Σ(r + 1)..m to 0 (we note the resulting vector (r)Σ), and the resulting low-rank approximation was obtained by
(r)X = U (r)Σ VT (2)
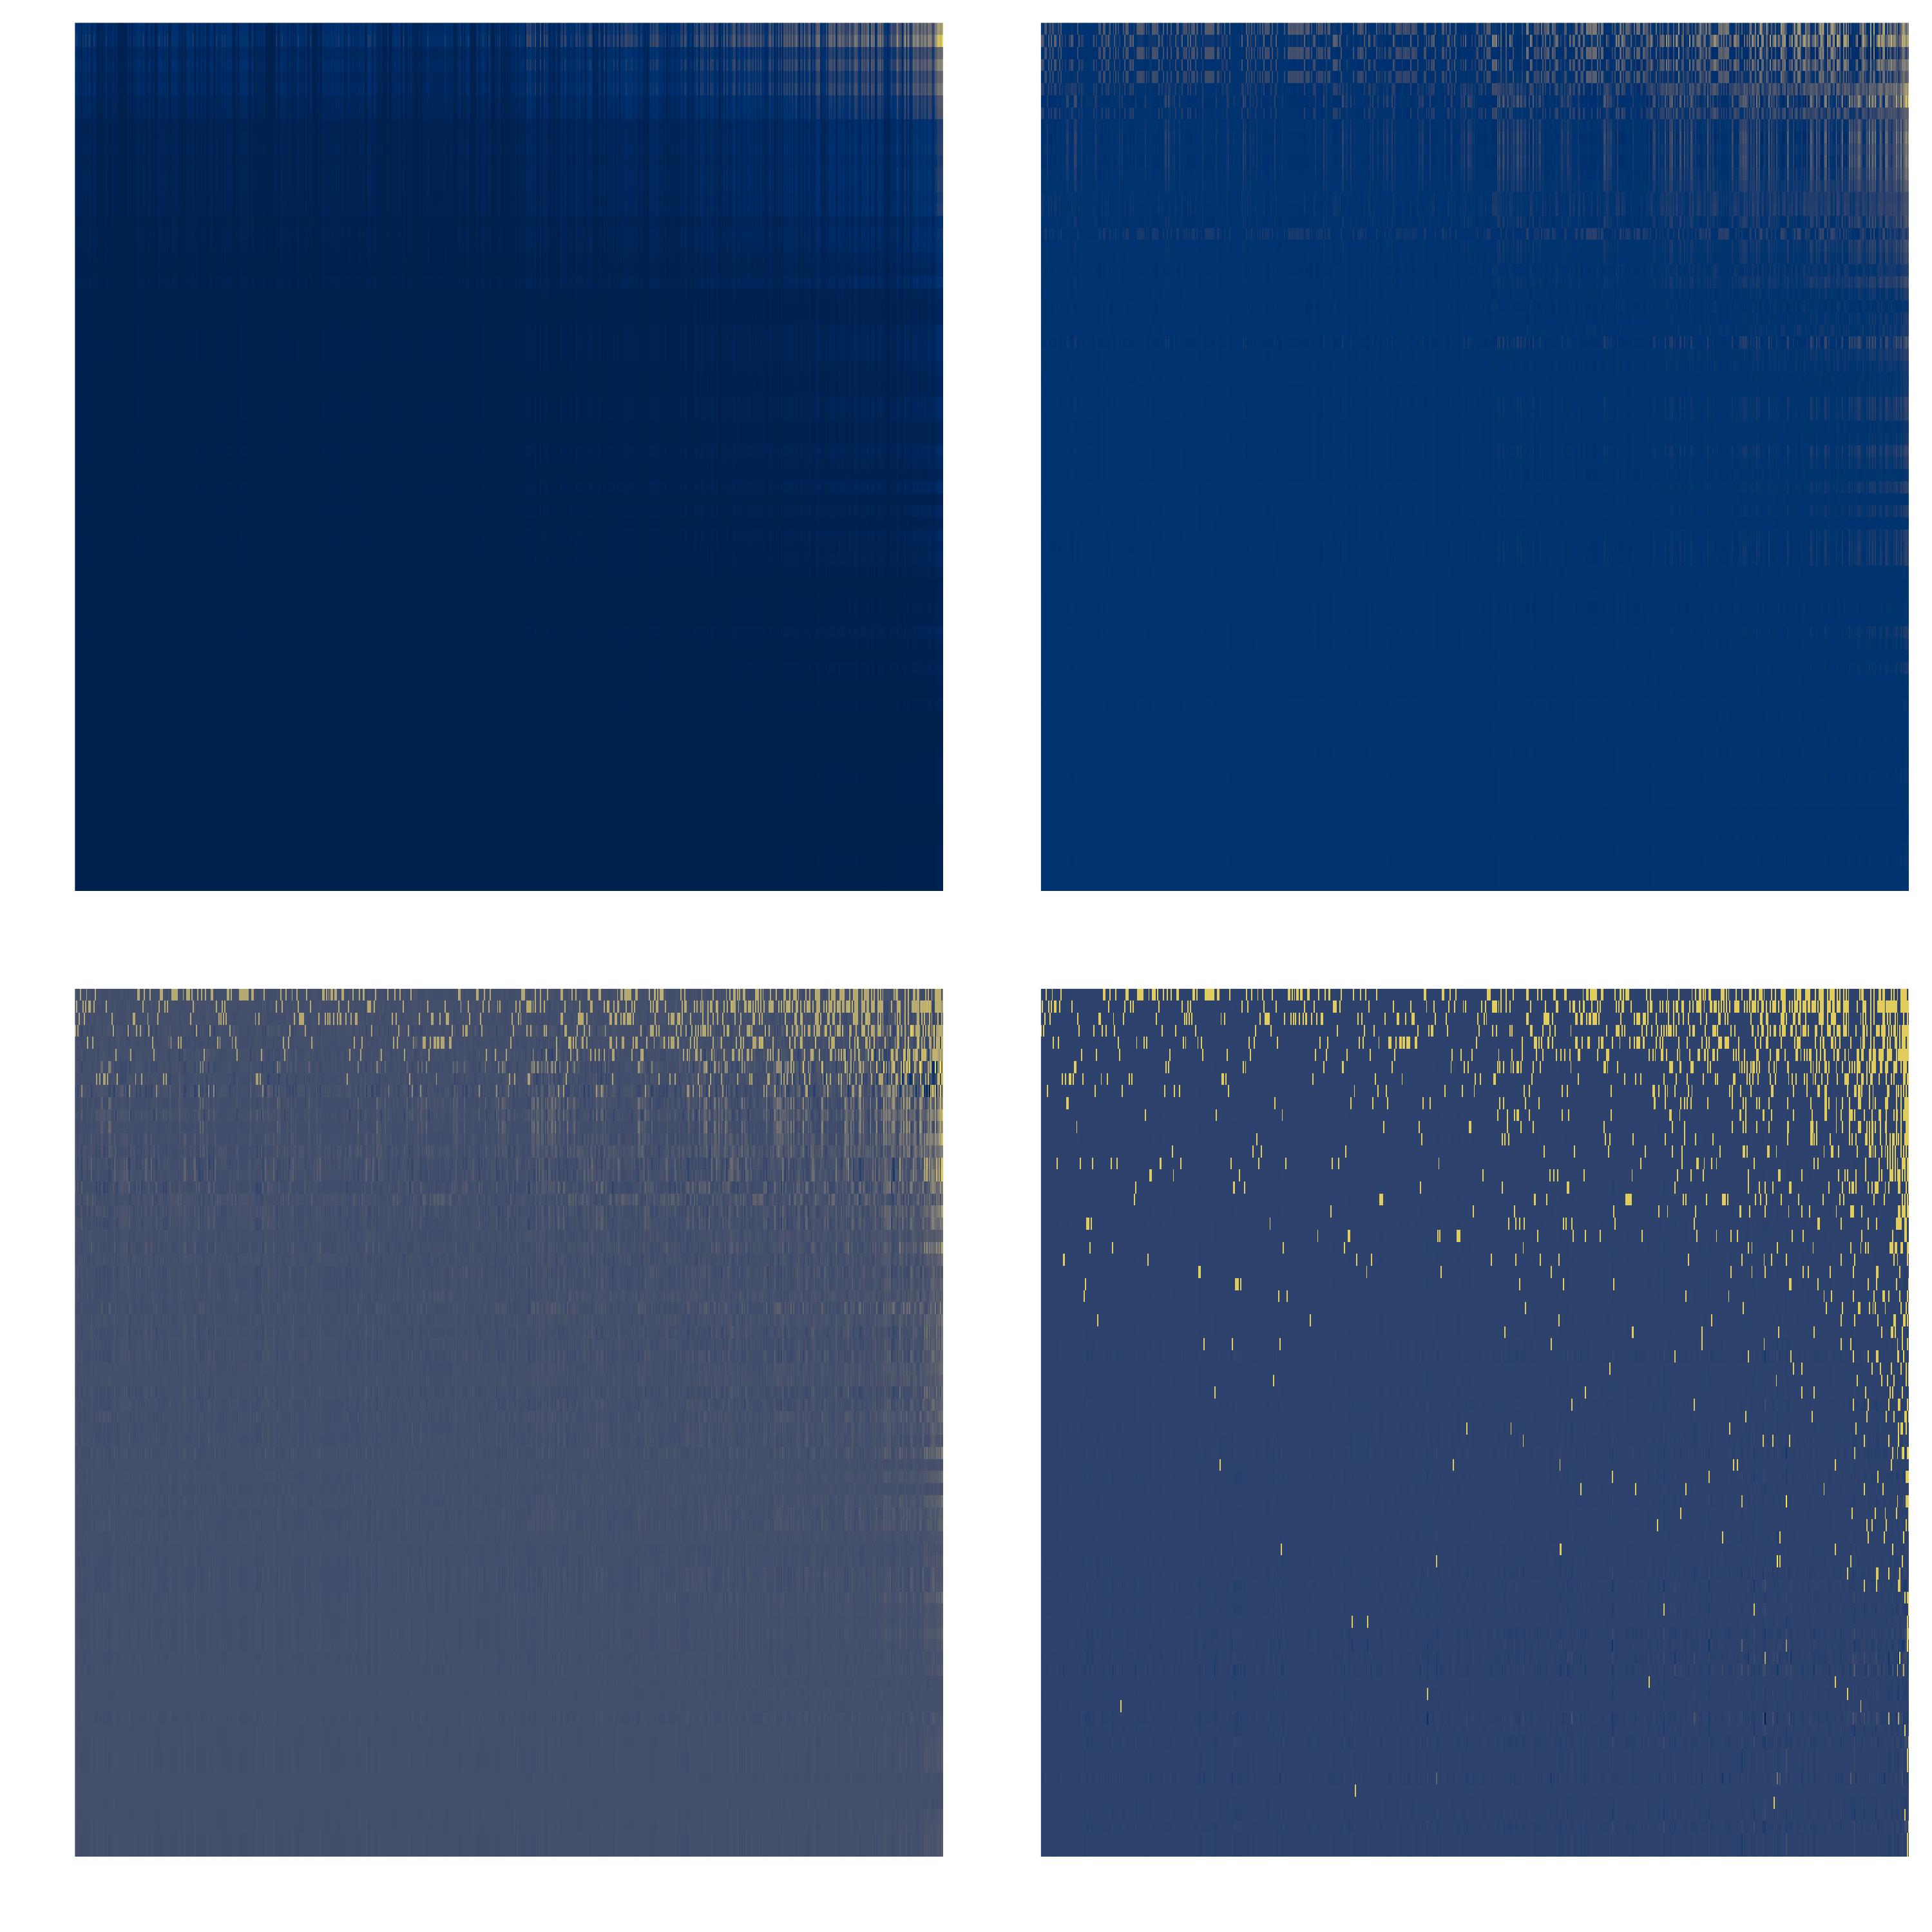
We illustrate the process on our dataset in fig. 1. Removing signal from the matrix through a low-rank approximation hinges on the assumption that most data are generated by “low-rank” processes, whereas the additional ranks would reflect noise or idiosyncracies acting in the dataset. Under this assumption, an imputation method using a low-rank approximation would have a good performance.
Model structure
For each non-interaction in the dataset, the model assigns an initial value to it and performs iteratively the SVD at chosen rank, until it reaches convergence. During this step, the cells in the matrix that are not being imputed are kept at their actual value. We capped the maximal number of iterations at 50, even though the value of the imputed cells stopped changing (defined as a step-wise change lower than 10 × ϵ) after less than 10 steps in most cases. The initial value that we first picked for this illustration is the connectance of the global host-virus interaction dataset, which amounts to the probability that any pair of organisms are found to interact (0.03).Yet, this can overestimate the importance of viruses with a narrow host range, or underestimate the importance of generalist viruses. For this reason, the assignment of the initial value was then determined based (Stock et al. 2017) work on linear filtering. This method provides a convenient way to assign weights to various aspects of network structure, and has been revealed to provide a good baseline estimate of how likely it is that a missing interaction actually exists, based on the structure of the interaction matrix, without the need of having other side information, such as traits or phylogeny. Considering our m × n data matrix X, the initial value of a missing interaction was fixed to the filtered value Fij :
$$\mathbf{F}_{i,j} = \mathbf{\alpha_{1}X_{i,j}+\alpha_{2}\frac{1}{m}\sum_{k=1}^m X_{kj} + \alpha_{3}\frac{1}{n}\sum_{l=1}^n X_{il} + \alpha_{4}\frac{1}{mn}\sum_{k=1}^m\sum_{l=1}^n X_{kl} }\qquad(3)$$
where $\sum\limits_{i=1}^4 \alpha_{i} = 1$ and αi ∈ [0, 1].
Prediction scoring
Using the linear filter allows to explore different hypotheses as to which parts of network structure are important for predictive ability. As we assume that the initial value of 0 in the matrix can be a false positive, we give it no weight in the model α1 = 0. TK change from here We then varied the other parameters on a regular grid of 304 points, where the values for α4 (impact of connectance), α2 (impact of the number of hosts), and α3 (impact of the number of viruses) was varied between 0 and 1. We then applied SVD imputation for each of these parameters combinations for ranks 1 to 3.
To rank the predictions made by the SVD-imputation, we took the value for every missing interaction after imputation, and divided it by the initial value, then substracted one. This gives an evidence score in ℝ, which we can transform into a probability in [0, 1] by taking its logistic; therefore, the final probability of an interaction is defined as
$$ P(x) = \frac{1}{1+e^{-x}}\,, $$
where x is the evidence for this interaction under our scoring system.
Model tuning and thresholding
One of the challenges associated with link prediction in this dataset is that non-interactions are not necessarily true negatives; most are simply missing data. To reach the best prediction, we need to answer three related questions. First, what model to assign initial values performs best? Second, what rank is sufficient to give the most accurate approximation of the matrix? Finally, what threshold on the interaction probability should be applied to the results of the best model at the appropriate rank?
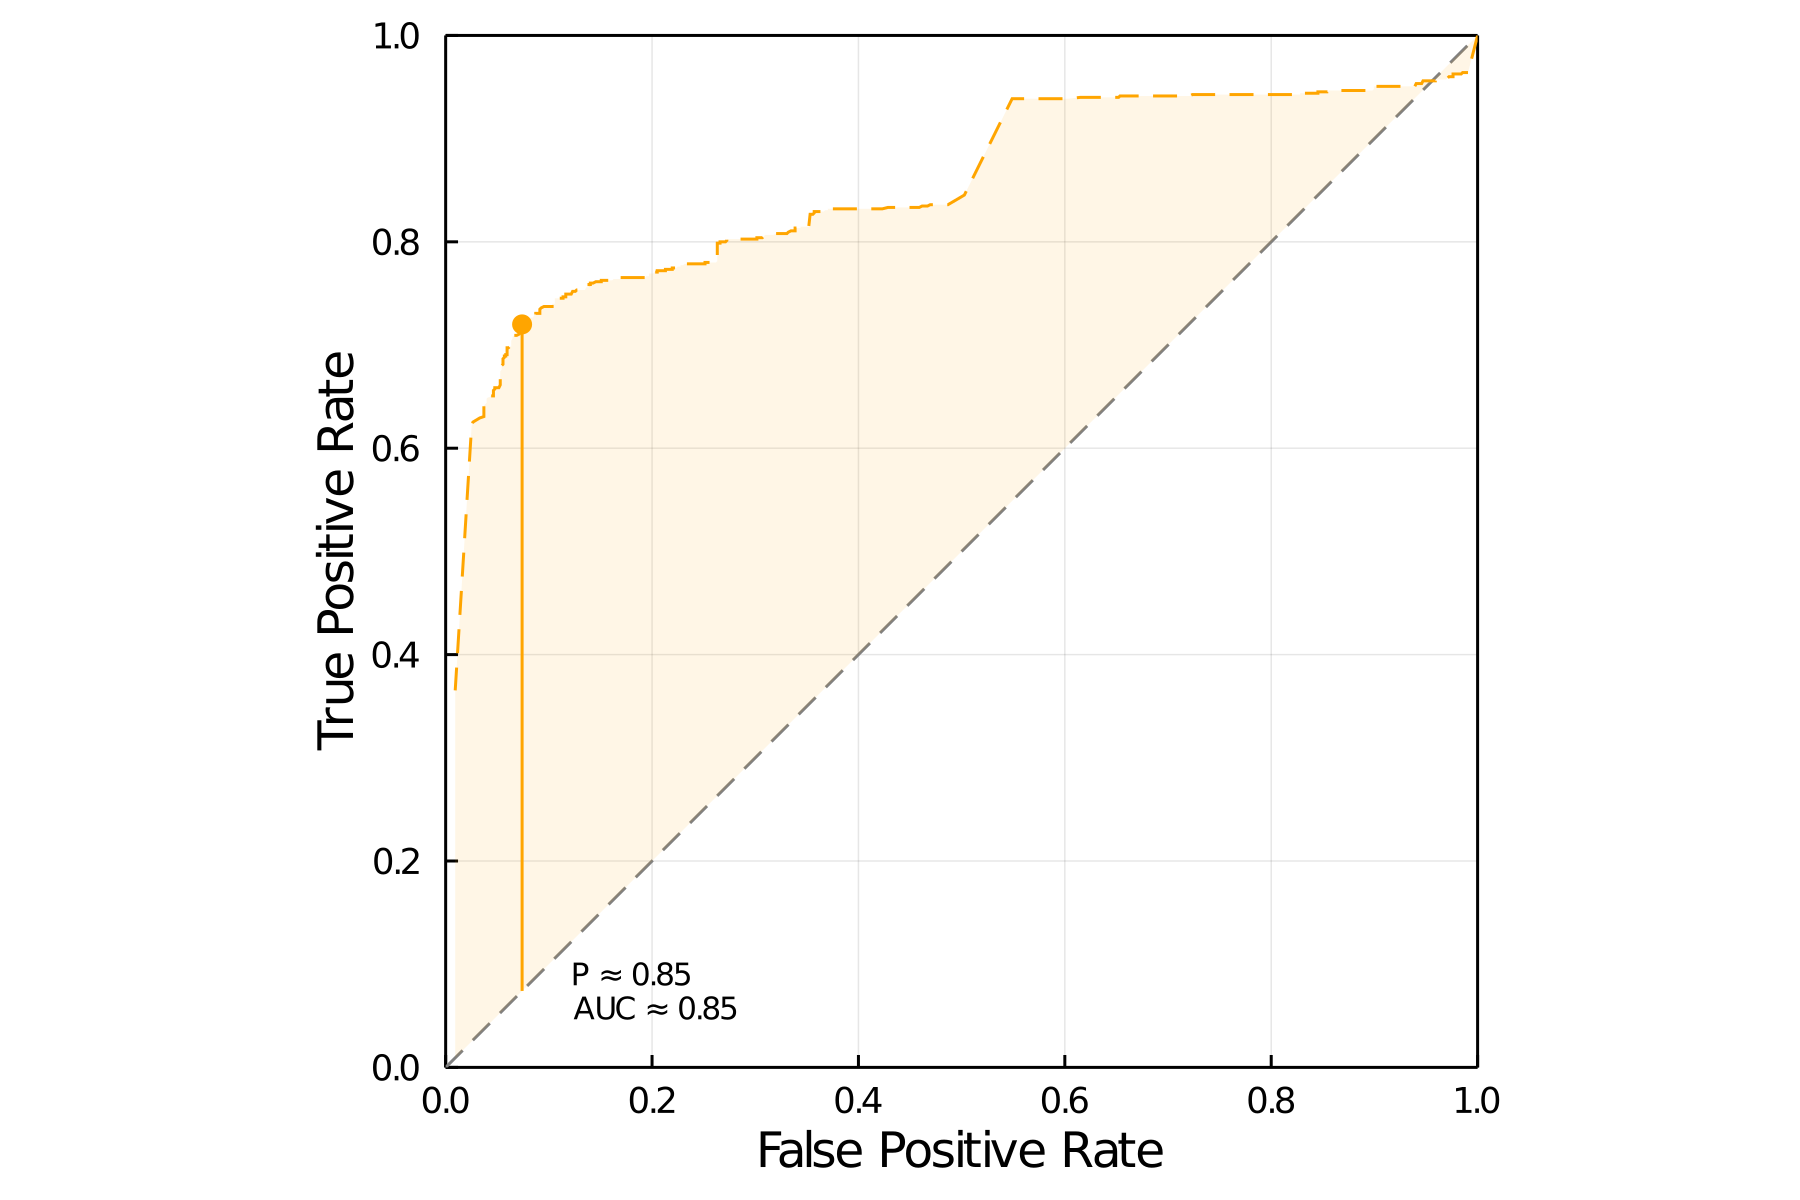
To answer this question, we first ran the LF-SVD imputation on a sample of 768 positive and 768 supposed negative interactions, at all ranks from 1 to 20, under the three initial value models above (degree, hybrid, and connectance). For each of these models, we measured the AUC of the ROC curve REF. To identify the optimal cutoff in this curve, we selected the probability score that maximizes Youden’s index of informedness, which works as a “total evidence” measure of model confidence, especially in datasets with severe imbalances in prevalence.
| model | rank | threshold | AUC | Youden’s index | false discovery | false omission | |
|---|---|---|---|---|---|---|---|
| 1 | connectance | 12 | 0.846 | 0.849 | 0.64 | 0.09 | 0.23 |
| 2 | connectance | 11 | 0.908 | 0.846 | 0.62 | 0.08 | 0.25 |
| 3 | connectance | 17 | 0.929 | 0.844 | 0.62 | 0.08 | 0.24 |
| 4 | connectance | 8 | 0.705 | 0.842 | 0.59 | 0.13 | 0.24 |
| 5 | hybrid | 12 | 0.707 | 0.841 | 0.58 | 0.14 | 0.25 |
The resulst of hyper-parameters tuning is presented in tbl. 1. The best performing model, using network connectance as an initial value, and a rank 12 approximation of the matrix, had a positive predictive value of 0.90, and a negative predictive value of 0.76, for an overall accuracy of 0.82. All things considered, given that the prevalence in the dataset is very low (only six out of every thousand species pair do have an interaction), the best model has strong predictive power. The ROC curve for this model is presented in fig. 2.
Results and Discussion
First, we report the top 10 likely hosts for betacoronaviruses, using the connectance of the network as initial values, which are ranked by their final value post imputation; larger values should indicate that the interactions are more likely to be possible. We report the novel hosts (identified post Becker et al. (2020), according to https://www.viralemergence.org/betacov). These results are presented in tbl. 2 - the novel hosts are presented in bold. Using a rank 2 approximation of the dataset, we have 5 novel hosts, and 4 identified as “suspected” hosts by the Becker et al. (2020) ensemble model, currently lacking empirical evidence. This suggests that rank 2 contains the most information about the processes generating the data, and can therefore be used to infer other associations.
| Rank 1 | Rank 2 |
|---|---|
| Artibeus jamaicensis | Hipposideros pomona |
| Scotophilus kuhlii | Scotophilus kuhlii |
| Molossus rufus | Artibeus jamaicensis |
| Sturnira lilium | Carollia brevicauda |
| Desmodus rotundus | Chaerephon pumilus |
| Glossophaga soricina | Molossus rufus |
| Eptesicus fuscus | Glossophaga soricina |
| Tadarida brasiliensis | Desmodus rotundus |
| Myotis nigricans | Sturnira lilium |
| Myotis lucifugus | Hipposideros larvatus |
Based on this information, we have also extracted the 10 highest scoring interactions across the entire matrix at rank 2 (Table 2). The results demonstrates that within the entire dataset, including all mammalian hosts and viruses’ genus, 5 out of the 10 highest scoring interactions are involving bat hosts (presented in italic), and 8 out of the 10 interactions are involving the lyssavirus genus. This genus includes the rabies virus (RABV), and other neurotropic rabies-related viruses (Warrell and Warrell 2004).
[Table 2: Top 10 likely missing interactions across the entire dataset using the connectance of the network as initial values]
| Hosts species | Viruses genus |
|---|---|
| Sus scrofa | Lyssavirus |
| Hipposideros armiger | Lyssavirus |
| Rattus norvegicus | Lyssavirus |
| Myodes glareolus | Lyssavirus |
| Pipistrellus abramus | Lyssavirus |
| Sus scrofa | Orbivirus |
| Capra hircus | Alphavirus |
| Rhinolophus sinicus | Lyssavirus |
| Myotis ricketti | Lyssavirus |
| Rhinolophus affinis | Lyssavirus |
Once those results were obtain, further investigations in the form of literature surveys allowed to identify that the interaction between Pipistrellus abramus} and lyssaviruses has already been noted by Hu et al. (2018); Shipley et al. (2019) reported lyssavirus prevalence in the genus Pipstrellus, Myotis, and Rhinolophus. Other confirmed hosts of lyssaviruses are Sus scrofa (Sato et al. 2004), and Rattus norvegicus (Wang, Tang, and Liang 2014). Surveillance for novel lyssaviruses infections is of great public health interest, since the rabies virus is fatal in all cases, once the onset of clinical symptoms has started (Banyard and Fooks 2017). Although it is recognized that bats are identified as reservoir hosts for lyssaviruses, the mechanism allowing the maintenance of the virus in those populations is still poorly understood (Banyard and Fooks 2017), and these predictions of interactions might serve as guidance in the monitoring of new infections.
The two non-lyssaviruses associations have been previously reported in the literature (Sus scrofa and orbivirus by Belaganahalli et al. (2015); Capra hircus and the equine encephalomyelitis caused by an alphavirus as early as Pursell et al. (1972)). This suggests that Singular Value Decomposition of available data on host-virus associations can uncover results that have been reported in the primary literature, but not incorporated in the main databases used in the field; based on the fact that the majority of the top 10 overall associations were able to be validated from the literature, we suggest that interactions that have no empirical evidence could be targets for additional sampling.
The initial value to be used for the imputation was then assigned according to the linear filter, as presented in the method section. The Table 3 presents the number of novel hosts predicted by the model, according to the coefficients used for the filter and to the rank.
[Table 3: Number of novel hosts for betacoronaviruses correctly predicted by the model using linear filtering for the attribution of initial values]
| Alpha | Rank 1 | Rank 2 | Rank 3 | Rank 4 | Rank 5 |
|---|---|---|---|---|---|
| [0, 0, 0, 1] | 3 | 3 | 1 | 3 | 4 |
| [0, $\frac{1}{2}$, $\frac{1}{2}$, 0] | 3 | 3 | 1 | 3 | 3 |
| [0, $\frac{1}{3}$, $\frac{1}{3}$, $\frac{1}{3}$] | 3 | 3 | 1 | 4 | 2 |
| [0, 1, 0, 0] | 3 | 3 | 1 | 3 | 3 |
| [0, 0, 1, 0] | 3 | 3 | 1 | 4 | 3 |
From the results presented in Table 3, it is possible to see that when using linear filtering for the assignment of initial values, the choice of the α parameters does not impact the accuracy of the predictions for the first three rank. The fourth and fifth rank then showed a variation per α values. The highest scoring interactions for every combinations was then examined and the variation of its value before and after the imputation has been calculated, and the results obtained are presented in Table 4.
[Table 4: Variation of the value pre and post imputation for the highest scoring interaction at every rank]
| Rank 1 | Rank 2 | Rank 3 | Rank 4 | Rank 5 |
|---|---|---|---|---|
| 0.536 | 0.765 | 0.700 | 0.990 | 1.261 |
This variation was not influenced by the α parameters, but only by the rank used. The variation calculated increased as the rank got higher.
Being able to identify intermediate animal hosts for potential zoonotic pathogens is an important step in the fight against potential threats to global public health. Using SVD as an imputation method to predict those interactions has demonstrated its potential to achieve this goal by correctly identifying the majority of the most likely associations, as validated by literature surveys, and by suggesting interactions with no empirical evidence as targets for additional sampling. Host-virus associations are a challenging imputation problem, because organized datasets are scarce – as a result, a lot of missing associations are reported in the literature, but not available in an easily usable format. Yet this also presents an opportunity to validate the performance of recommender systems that is far more interesting than cross-fold or leave-one-out validation: the existence of these interactions in the literature can provide validation on data that have never been used in the modeling process, and therefore provide an accurate estimate of how frequently existing interactions are identified. By this measure, that most of the top 10 recommendations on this dataset were validated through de novo sampling (for bat hosts of betacoronaviruses) or by a literature survey (for the global dataset) is a strong indication that SVD is able to uncover likely host-virus pairs.
Future work on the use of SVD for virus host associations will have to adress the question of the initial value used in the imputation process in further details. As of now, we relied on the average number of interactions in the matrix, and on weighted allocations for different aspects of the network structure, based on Stock et al. (2017) work on linear filtering. This method can provide a good baseline estimate of how likely it is that a missing interaction could actually exist (and in fact was developed for this purpose). For this reason, we are confident that the performance of the approach can further be improved by fine-tuning the choice of the initial value used for imputation, according to the dataset used, or by relying on ensemble models that would aggregate the output of the best recommenders. Combining an accurate model for the initial value with the SVD imputation is likely to generate predicted interactions that are strong candidates for empirical validation.
Acknowledgements: This research was enabled in part by support provided by Calcul Québec (www.calculquebec.ca) and Compute Canada (www.computecanada.ca). TP and CC were funded by IVADO through the rapid response to COVID special initiative.