Introduction
There are two core challenges we are faced with in furthering our understanding of ecological networks across space, particularly at macro-ecologically relevant scales (e.g. Trøjelsgaard & Olesen, 2016). First, ecological networks within a location are difficult to sample properly (Jordano, 2016a, 2016b), resulting in a widespread “Eltonian shortfall” (Hortal et al., 2015), i.e. a lack of knowledge about inter- and intra- specific relationships. This first challenge has been, in large part, addressed by the recent emergence of a suite of methods aiming to predict interactions within existing networks, many of which are reviewed in Strydom, Catchen, et al. (2021). Second, recent analyses based on collected data (Poisot, Bergeron, et al., 2021) or metadata (Cameron et al., 2019) highlight that ecological networks are currently studied in a biased subset of space and bioclimates, which impedes our ability to generalize any local understanding of network structure. Meaning that, although the framework to address incompleteness within networks exists, there would still be regions for which, due to a lack of local interaction data, we are unable to infer potential species interactions.
Here, we present a general method to infer potential trophic interactions, relying on the transfer learning of network representations, specifically by using similarities of species in a biologically/ecologically relevant proxy space (e.g. shared morphology or ancestry). Transfer learning is a machine learning methodology that uses the knowledge gained from solving one problem and applying it to a related (destination) problem (Pan & Yang, 2010; Torrey & Shavlik, 2010). In this instance, we solve the problem of predicting trophic interactions between species, based on knowledge extracted from another species pool for which interactions are known by using phylogenetic structure as a medium for transfer. There is a plurality of measures of species similarities that can be used for inferring potential species interactions i.e. metaweb reconstruction (see e.g. Morales-Castilla et al., 2015); however, phylogenetic proximity has several desirable properties when working at large scales. Gerhold et al. (2015) made the point that phylogenetic signal captures diversification of characters (large macro-evolutionary process), but not necessarily community assembly (fine ecological process); Dormann et al. (2010) previously found very similar conclusions. Interactions tend to reflect a phylogenetic signal because they have a conserved pattern of evolutionary convergence that encompasses a wide range of ecological and evolutionary mechanisms (Cavender-Bares et al., 2009; Mouquet et al., 2012), and - most importantly - retain this signal even if it is obscured at the community scale due to e.g. local conditions (Hutchinson et al., 2017; Poisot & Stouffer, 2018). Finally, species interactions at macro-ecological scales seem to respond mostly to macro-evolutionary processes (Price, 2003); which is evidenced by the presence of conserved backbones in food webs (Bramon Mora et al., 2018; Dalla Riva & Stouffer, 2016), strong evolutionary signature on prey choice (Stouffer et al., 2012), and strong phylogenetic signature in food web intervality (Eklöf & Stouffer, 2016). Phylogenetic reconstruction has also previously been used within the context of ecological networks, namely understanding ancestral plant-insect interactions (Braga et al., 2021). Taken together, these considerations suggest that phylogenies can reliably be used to transfer knowledge on species interactions.
In fig. 1, we provide a methodological overview based on learning the embedding of a metaweb of trophic interactions for European mammals (known interactions; Maiorano et al., 2020a, 2020b) and, based on phylogenetic relationships between mammals globally (i.e., phylogenetic tree Upham et al., 2019), infer a metaweb for the Canadian mammalian species pool (using only a species list i.e. we have no prior data on species interaction data for Canada in this instance). Our case study shows that phylogenetic transfer learning is an effective approach to the generation of probabilistic metawebs. This showcases that although the components (species) that make up the Canadian and European communities may be minimally shared (the overall species overlap is less than 4%), if the medium (proxy space) selected in the transfer step is biologically plausible, we can still effectively learn from the known network and make biologically relevant predictions of interactions. Indeed, as we detail in the results, when validated against the known (but fractional) data of trophic interactions present between Canadian mammals, our model achieves a predictive accuracy of approximately 91%.
Method description
The core point of our method is the transfer of knowledge of a known ecological network to predict interactions between species for another location for which the network is unknown (or partially known) and is summarized in the grey text boxes in fig. 1. The method we develop is, ecologically speaking, a “black box,” i.e. an algorithm that can be understood mathematically, but whose component parts are not always directly tied to ecological processes. There is a growing realization in machine learning that (unintentional) black box algorithms are not necessarily a bad thing (Holm, 2019), as long as their constituent parts can be examined (which is the case with our method). But more importantly, data hold more information than we might think; as such, even algorithms that are disconnected from a model can make correct guesses most of the time (Halevy et al., 2009); in fact, in an instance of ecological forecasting of spatio-temporal systems, model-free approaches (i.e. drawing all of their information from the data) outperformed model-informed ones (Perretti et al., 2013).
Data used for the case study
We use data from the European metaweb assembled by Maiorano et al. (2020a). This was assembled using data extracted from scientific literature (including published papers, books, and grey literature) from the last 50 years and includes all terrestrial tetrapods (mammals, breeding birds, reptiles and amphibians) occurring on the European sub-continent (and Turkey) - with the caveat that only species introduced in historical times and currently naturalized being included. The European metaweb was filtered using the Global Biodiversity Information Facility (GBIF) taxonomic backbone (GBIF Secretariat, 2021) so as to contain only terrestrial and semi-aquatic mammals. As all species had valid matches to the GBIF taxonomy it was used as the backbone for the remaining reconciliation steps namely, the mammalian consensus supertree by Upham et al. (2019) (which is used for the knowledge transfer step) and for the Canadian species list—which was extracted from the International Union for Conservation of Nature (IUCN) checklist, and corresponds to the same selection criteria that was applied by Maiorano et al. (2020a) in the European metaweb. After taxonomic cleaning and reconciliation the European metaweb has 260 species, and the Canadian species pool 163; of these, 17 (about 4% of the total) are shared, and 89 species from Canada (54%) had at least one congeneric species in Europe. The similarity for both species pools predictably increases with higher taxonomic order, with 19% of shared genera, 47% of shared families, and 75% of shared orders; for the last point, Canada and Europe each had a single unique order (Didelphimorphia for Canada, Erinaceomorpha for Europe).
Implementation and code availability
The entire pipeline is implemented in Julia 1.6 (Bezanson et al., 2017) and is available under the permissive MIT License at https://osf.io/2zwqm/. The taxonomic cleanup steps are done using GBIF.jl (Dansereau & Poisot, 2021). The network embedding and analysis is done using EcologicalNetworks.jl (Banville et al., 2021; Poisot et al., 2019). The phylogenetic simulations are done using PhyloNetworks.jl (Solís-Lemus et al., 2017) and Phylo.jl (Reeve et al., 2016). A complete Project.toml file specifying the full tree of dependencies is available alongside the code. This material also includes a fully annotated copy of the entire code required to run this project (describing both the intent of the code and discussing some technical implementation details), a vignette for every step of the process, and a series of Jupyter notebooks with the text and code. The pipeline can be executed on a laptop in a matter of minutes, and therefore does not require extensive computational power.
Step 1: Learning the origin network representation
The first step in transfer learning is to learn the structure of the original dataset. In order to do so, we rely on an approach inspired from representational learning, where we learn a representation of the metaweb (in the form of the latent subspaces), rather than a list of interactions (species a eats b). This approach is conceptually different from other metaweb-scale predictions (e.g. Albouy et al., 2019), in that the metaweb representation is easily transferable. Specifically, we use a Random Dot Product Graph model (hereafter RDPG; S. J. Young & Scheinerman, 2007) to create a number of latent variables that can be combined into an approximation of the network adjacency matrix. RDPG is known to capture the evolutionary backbone of food webs (Dalla Riva & Stouffer, 2016), resulting in strong phylogenetic signal in RDPG results; in other words, the latent variables of an RDPG can be mapped onto a phylogenetic tree, and phylogenetically similar predators should share phylogenetically similar preys. In addition, recent advances show that the latent variables produced this way can be used to predict de novo interactions. Interestingly, the latent variables do not need to be produced by decomposing the network itself; in a recent contribution, Runghen et al. (2021) showed that deep artificial neural networks are able to reconstruct the left and right subspaces of an RDPG, in order to predict human movement networks from individual/location metadata and opens up the possibility of using additional metadata as predictors.
The latent variables are created by performing a truncated Singular Value Decomposition (t-SVD; Halko et al., 2011) on the adjacency matrix. SVD is an appropriate embedding of ecological networks, which has recently been shown to both capture their complex, emerging properties (Strydom, Dalla Riva, et al., 2021) and to allow highly accurate prediction of the interactions within a single network (Poisot, Ouellet, et al., 2021). Under SVD, an adjacency matrix A (where Am, n ∈ 𝔹 where 1 indicates predation and 0 an absence thereof) is decomposed into three components resulting in A = UΣV′. Here, Σ is a m × n diagonal matrix and contains only singular (σ) values along its diagonal, U is a m × m unitary matrix, and V′ a n × n unitary matrix. Truncating the SVD removes additional noise in the dataset by omitting non-zero and/or smaller σ values from Σ using the rank of the matrix. Under a t-SVD Am, n is decomposed so that Σ is a square r × r diagonal matrix (with 1 ≤ r ≤ rfull where rfull is the full rank of A and r the rank at which we truncate the matrix) containing only non-zero σ values. Additionally, U is now an m × r semi unitary matrix and V′ an r × n semi-unitary matrix.
The specific rank at which the SVD ought to be truncated is a difficult question. The purpose of SVD is to remove the noise (expressed at high dimensions) and to focus on the signal (expressed at low dimensions). In datasets with a clear signal/noise demarcation, a scree plot of Σ can show a sharp drop at the rank where noise starts (Zhu & Ghodsi, 2006). Because the European metaweb is almost entirely known, the amount of noise (uncertainty) is low; this is reflected in fig. 2 (left), where the scree plot shows no important drop, and in fig. 2 (right) where the proportion of variance explained increases smoothly at higher dimensions. For this reason, we default back to a threshold that explains 60% of the variance in the underlying data, corresponding to 12 dimensions - i.e. a tradeoff between accuracy and a reduced number of features.
An RDPG estimates the probability of observing interactions between nodes (species) as a function of the nodes’ latent variables, and is a way to turn an SVD (which decompose one matrix into three) into two matrices that can be multiplied to provide an approximation of the network. The latent variables used for the RDPG, called the left and right subspaces, are defined as $\mathscr{L} = \mathbf{U}\sqrt{\mathbf{\Sigma}}$, and $\mathscr{R} = \sqrt{\mathbf{\Sigma}}\mathbf{V}'$ – using the full rank of A, ℒℛ = A, and using any smaller rank results in ℒℛ ≈ A. Using a rank of 1 for the t-SVD provides a first-order approximation of the network. One advantage of using an RDPG for the network reconstruction rather than an SVD is that the number of components to estimate decreases; notably, one does not have to estimate the singular values of the SVD. Furthermore, the two subspaces can be directly multiplied to yield a network.

Because RDPG relies on matrix multiplication, the higher dimensions essentially serve to make specific interactions converge towards 0 or 1; therefore, for reasonably low ranks, there is no guarantee that the values in the reconstructed network will be within the unit range. In order to determine what constitutes an appropriate threshold for probability, we performed the RDPG approach on the European metaweb, and evaluated the probability threshold by treating this as a binary classification problem, specifically assuming that both 0 and 1 in the European metaweb are all true. Given the methodological details given in Maiorano et al. (2020a) and O’Connor et al. (2020), this seems like a reasonable assumption, although one that does not hold for all metawebs. We used the thresholding approach presented in Poisot, Ouellet, et al. (2021), and picked a cutoff that maximized Youden’s J statistic (a measure of the informedness (trust) of predictions; Youden (1950)); the resulting cutoff was 0.22, and gave an accuracy above 0.99. In Supp. Mat. 1, we provide several lines of evidence that using the entire network to estimate the threshold does not lead to overfitting; that using a subset of species would yield the same threshold; that decreasing the quality of the original data by adding or removing interactions would minimally affect the predictive accuracy of RDPG applied to the European metaweb; and that the networks reconstructed from artificially modified data are reconstructed with the correct ecological properties.
The left and right subspaces for the European metaweb, accompanied by the threshold for prediction, represent the knowledge we seek to transfer. In the next section, we explain how we rely on phylogenetic similarity to do so.
Steps 2 and 3: Transfer learning through phylogenetic relatedness
In order to transfer the knowledge from the European metaweb to the Canadian species pool, we performed ancestral character estimation using a Brownian motion model, which is a conservative approach in the absence of strong hypotheses about the nature of phylogenetic signal in the network decomposition (Litsios & Salamin, 2012). This uses the estimated feature vectors for the European mammals to create a state reconstruction for all species (conceptually something akin to a trait-based mammalian phylogeny using latent generality and vulnerability traits) and allows us to impute the missing (latent) trait data for the Canadian species that are not already in the European network; as we are focused on predicting contemporary interactions, we only retained the values for the tips of the tree. We assumed that all traits (i.e. the feature vectors for the left and right subspaces) were independent, which is a reasonable assumption as every trait/dimension added to the t-SVD has an additive effect to the one before it. Note that the Upham et al. (2019) tree itself has some uncertainty associated to inner nodes of the phylogeny. In this case study we have decided to not propagate this uncertainty as it would complexify the process. The Brownian motion algorithm returns the average value of the trait, and its upper and lower bounds. Because we do not estimate other parameters of the traits’ distributions, we considered that every species trait is represented as a uniform distribution between these bounds. The choice of the uniform distribution was made because the algorithm returns a minimum and maximum point estimate for the value, and given this information, the uniform distribution is the one with maximum entropy. Had all mean parameters estimates been positive, the exponential distribution would have been an alternative, but this is not the case for the subspaces of an RDPG. In order to examine the consequences of the choice of distribution, we estimated the variance per latent variable per node to use a Normal distribution; as we show in Supp. Mat. 2, this decision results in dramatically over-estimating the number and probability of interactions, and therefore we keep the discussions in the main text to the uniform case. The inferred left and right subspaces for the Canadian species pool ($\hat{\mathscr{L}}$ and $\hat{\mathscr{R}}$) have entries that are distributions, representing the range of values for a given species at a given dimension. These objects represent the transferred knowledge, which we can use for prediction of the Canadian metaweb.
Step 4: Probabilistic prediction of the destination network
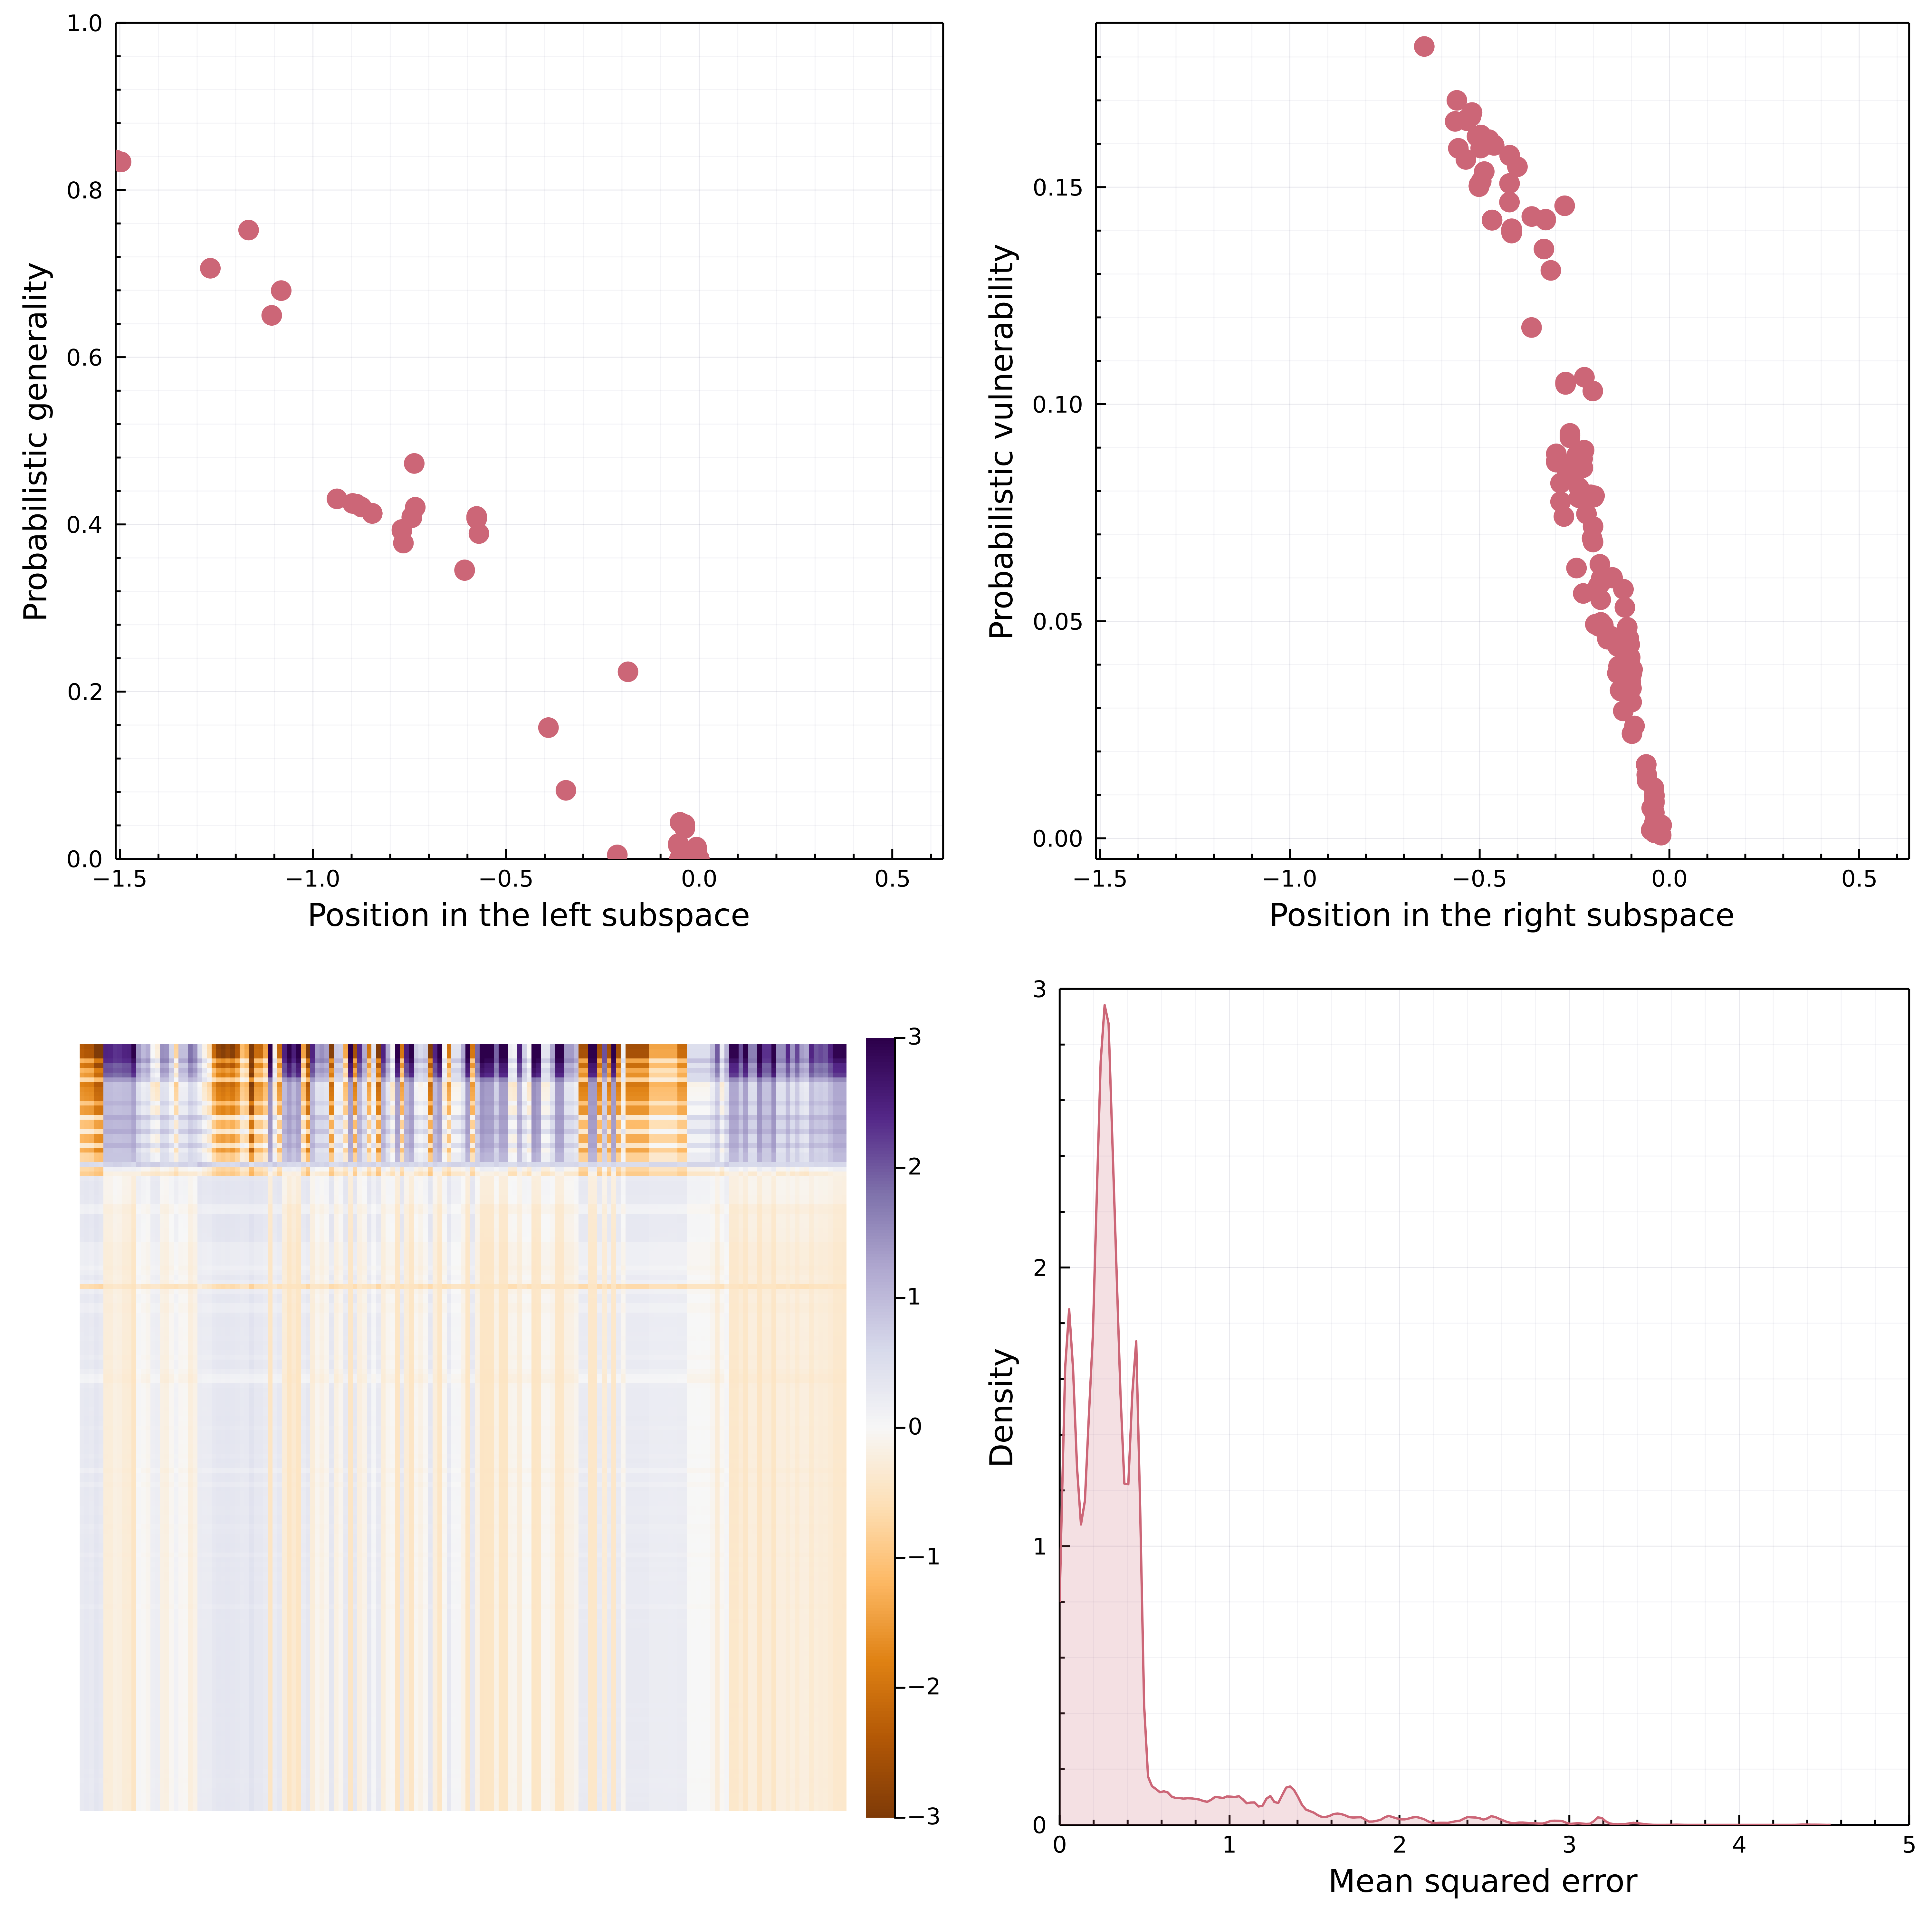
The phylogenetic reconstruction of $\hat{\mathscr{L}}$ and $\hat{\mathscr{R}}$ has an associated uncertainty, represented by the breadth of the uniform distribution associated to each of their entries. Therefore, we can use this information to assemble a probabilistic metaweb in the sense of Poisot et al. (2016), i.e. in which every interaction is represented as a single, independent, Bernoulli event of probability p.
Specifically, we have adopted the following approach. For every entry in $\hat{\mathscr{L}}$ and $\hat{\mathscr{R}}$, we draw a value from its distribution. This results in one instance of the possible left ($\hat{\mathscr{l}}$) and right ($\hat{\mathscr{r}}$) subspaces for the Canadian metaweb. These can be multiplied, to produce one matrix of real values. Because the entries in $\hat{\mathscr{l}}$ and $\hat{\mathscr{r}}$ are in the same space where ℒ and ℛ were originally predicted, it follows that the threshold ρ estimated for the European metaweb also applies. We use this information to produce one random Canadian metaweb, $N = \hat{\mathscr{L}}\hat{\mathscr{R}}' \ge \rho$. As we can see in (fig. 3), the European and Canadian metawebs are structurally similar (as would be expected given the biogeographic similarities) and the two (left and right) subspaces are distinct i.e. capturing predation (generality) and prey (vulnerability) latent traits.
Because the intervals around some trait values can be broad (in fact, probably broader than what they would actually be, see e.g. Garland et al., 1999), we repeat the above process 2 × 10⁵ times, which results in a probabilistic metaweb P, where the probability of an interaction (here conveying our degree of trust that it exists given the inferred trait distributions) is given by the number of times where it appears across all random draws N, divided by the number of samples. An interaction with Pi, j = 1 means that these two species were predicted to interact in all 2 × 10⁵ random draws.
It must be noted that despite bringing in a large amount of information from the European species pool and interactions, the Canadian metaweb has distinct structural properties. Following an approach similar to Vermaat et al. (2009), we show in Supp. Mat. 3 that not only can we observe differences in the multivariate space between the European and Canadian metawebs, we can also observe differences in the same space between random subgraphs from these networks. These results line up with the studies spatializing metawebs that have been discussed in the introduction: changes in the species pool are driving local structural changes in the networks.
Data cleanup, discovery, validation, and thresholding
Once the probabilistic metaweb for Canada has been produced, we followed a number of data inflation steps to finalize it. This step is external to the actual transfer learning framework but rather serves as a way to augment and validate the predicted metaweb.
First, we extracted the network corresponding to the 17 species shared between the European and Canadian pools and replaced these interactions with a probability of 0 (non-interaction) or 1 (interaction), according to their value in the European metaweb. This represents a minute modification of the inferred network (about 0.8% of all species pairs from the Canadian web), but ensures that we are directly re-using knowledge from Europe.
Second, we looked for all species in the Canadian pool known to the Global Biotic Interactions (GloBI) database (Poelen et al., 2014), and extracted their known interactions. Because GloBI aggregates observed interactions, it is not a networks data source, and therefore the only information we can reliably extract from it is that a species pair was reported to interact at least once. This last statement should yet be taken with caution, as some sources in GloBI (e.g. Thessen & Parr, 2014) are produced through text analysis, and therefore may not document direct evidence of the interaction. Nevertheless, should the predictive model work, we would expect that a majority of interactions known to GloBI would also be predicted. We retrieved 366 interactions between mammals from the Canadian species pool from GloBI, 33 of which were not predicted by the model; this results in a success rate of 91%. After performing this check, we set the probability of all interactions known to GloBI to 1.
Finally, we downloaded the data from Strong & Leroux (2014), who mined various literature sources to identify trophic interactions in Newfoundland. This dataset documented 25 interactions between mammals, only two of which were not part of our (Canada-level) predictions, resulting in a success rate of 92%. These two interactions were added to our predicted metaweb with a probability of 1. A comparison of interaction densities for the inferred metaweb, and the Globi and Newfoundland is shown in fig. 4 and a table listing all interactions in the predicted Canadian metaweb can be found in the supplementary material.
Because the confidence intervals on the inferred trait space are probably over-estimates, we decided to apply a thresholding step to the interactions after data inflation (see fig. 5 showing the effect of varying the cutoff on P(i → j)). Cirtwill & Hambäck (2021) proposed a number of strategies to threshold probabilistic networks. Their methodology assumes the underlying data to be tag-based sequencing, which represents interactions as co-occurrences of predator and prey within the same tags; this is conceptually identical to our Bernoulli-trial based reconstruction of a probabilistic network. We performed a full analysis of the effect of various cutoffs, and as they either resulted in removing too few interactions, or removing enough interactions that species started to be disconnected from the network, we set this threshold for a probability equivalent to 0 to the largest possible value that still allowed all species to have at least one interaction with a non-zero probability. The need for this slight deviation from the Cirtwill & Hambäck (2021) methodology highlights the need for additional development on network thresholding.
Results and discussion
Using a transfer learning framework we were able to construct a probabilistic metaweb and (as per Dunne, 2006) is a list of potential interactions, meaning that they will not necessarily be realized wherever the two species co-occur. The t-SVD embedding is able to learn relevant ecological features for the network. fig. 6 shows that the first rank correlates linearly with generality and vulnerability (Schoener, 1989), i.e. the number of preys and predators for each species. Importantly, this implies that a rank 1 approximation represents the configuration model for the metaweb, i.e. a set of random networks generated from a given degree sequence (Park & Newman, 2004). Accounting for the probabilistic nature of the degrees, the rank 1 approximation also represents the soft configuration model (van der Hoorn et al., 2018). Both models are maximum entropy graph models (Garlaschelli et al., 2018), with sharp (all network realizations satisfy the specified degree sequence) and soft (network realizations satisfy the degree sequence on average) local constraints, respectively. The (soft) configuration model is an unbiased random graph model widely used by ecologists in the context of null hypothesis significance testing of network structure (e.g. Bascompte et al., 2003) and can provide informative priors for Bayesian inference of network structure (e.g. J.-G. Young et al., 2021). It is noteworthy that for this metaweb, the relevant information was extracted at the first rank. Because the first rank corresponds to the leading singular value of the system, the results of fig. 6 have a straightforward interpretation: degree-based processes are the most important in structuring the mammalian food web.
One important aspect in which Europe and Canada differ (despite their comparable bioclimatic conditions) is the degree of the legacy of human impacts, which have been much longer in Europe. Nenzén et al. (2014) showed that even at small scales (the Iberian peninsula), mammal food webs retain the signal of both past climate change and human activity, even when this human activity was orders of magnitude less important than it is now. Similarly, Yeakel et al. (2014) showed that changes in human occupation over several centuries can lead to food web collapse. Megafauna in particular seems to be very sensitive to human arrival (Pires et al., 2015). In short, there is well-substantiated support for the idea that human footprint affects more than the risk of species extinction (Marco et al., 2018), and can lead to changes in interaction structure.
Cirtwill et al. (2019) showed that network inference techniques based on Bayesian approaches would perform far better in the presence of an interaction-level informative prior; the desirable properties of such a prior would be that it is expressed as a probability, preferably representing a Bernoulli event, the value of which would be representative of relevant biological processes (probability of predation in this case). We argue that the probability returned at the very last step of our framework may serve as this informative prior; indeed, the output of our analysis can be used in subsequent steps, also possibly involving expert elicitation to validate some of the most strongly recommended interactions. One important caveat to keep in mind when working with interaction inference is that interactions can never really be true negatives (in the current state of our methodological framework and data collection limitations); this renders the task of validating a model through the usual application of binary classification statistics very difficult (although see Strydom, Catchen, et al., 2021 for a discussion of alternative suggestions). The other way through which our framework can be improved is by substituting the predictors that are used for transfer. For example, in the presence of information on species traits that are known to be predictive of species interactions, one might want to rely on functional rather than phylogenetic distances – in food webs, body size (and allometrically related variables) has been established as such a variable (Brose et al., 2006); the identification of relevant functional traits is facilitated by recent methodological developments (Rosado et al., 2013).
Finally, it should be noted that the framework we have presented is amenable to changes lending to applicability to a broad range of potential scenarios. For example in this case study we have embedded the original metaweb using t-SVD, because it lends itself to an RDPG reconstruction, which is known to capture the consequences of evolutionary processes (Dalla Riva & Stouffer, 2016); this being said, there are other ways to embed graphs (Arsov & Mirceva, 2019; Cai et al., 2017; Cao et al., 2019), which can be used as alternatives. Regarding the transfer step it is possible to use distinct trees if working with distinct clades (such as pollination networks) or an alternative measure of similarity (transfer medium) such as information on foraging (Beckerman et al., 2006), cell-level mechanisms (Boeckaerts et al., 2021), or a combination of traits and phylogenetic structure (Stock, 2021). Most importantly, although we focus on a trophic system, it is an established fact that different (non-trophic) interactions do themselves interact with and influence the outcome of trophic interactions (see e.g. Kawatsu et al., 2021; Kéfi et al., 2012). Future development of metaweb inference techniques should cover the prediction of multiple interaction types.
Acknowledgements: We acknowledge that this study was conducted on land within the traditional unceded territory of the Saint Lawrence Iroquoian, Anishinabewaki, Mohawk, Huron-Wendat, and Omàmiwininiwak nations. TP, TS, DC, and LP received funding from the Canadian Institute for Ecology & Evolution. FB is funded by the Institute for Data Valorization (IVADO). TS, SB, and TP are funded by a donation from the Courtois Foundation. CB was awarded a Mitacs Elevate Fellowship no. IT12391, in partnership with fRI Research, and also acknowledges funding from Alberta Innovates and the Forest Resources Improvement Association of Alberta. M-JF acknowledges funding from NSERC Discovery Grant and NSERC CRC. RR is funded by New Zealand’s Biological Heritage Ngā Koiora Tuku Iho National Science Challenge, administered by New Zealand Ministry of Business, Innovation, and Employment. BM is funded by the NSERC Alexander Graham Bell Canada Graduate Scholarship and the FRQNT master’s scholarship. LP acknowledges funding from NSERC Discovery Grant (NSERC RGPIN-2019-05771). TP acknowledges financial support from NSERC through the Discovery Grants and Discovery Accelerator Supplement programs. MJF is supported by an NSERC PDF and an RBC Post-Doctoral Fellowship
Conflict of interest: The authors have no conflict interests to disclose
Authors’ contributions: TS, SB, and TP designed the study and performed the analysis; GVDR, MF, and RR provided additional feedback on the analyses. DC, BM, and FB helped with data collection. All authors contributed to writing and editing the manuscript.
Data availability: All code and data used in this manuscript is publicly available and archived on OSF https://osf.io/2zwqm/ and is currently referenced in the manuscript.